Menu
mtDNA Haplogroup • Maternal Lineage

L2B1A3

mtDNA Haplogroup L2B1A3

~4,000 years ago
West/Central Africa
0 subclades
Scroll to explore
Chapter I

The Story

The journey of mtDNA haplogroup L2B1A3

Origins and Evolution

mtDNA haplogroup L2B1A3 is a subclade nested within the L2b1a branch of haplogroup L2. Its deeper parent, L2b1a, is well-established as a Holocene West/Central African lineage (origin ~7 kya). L2B1A3 represents a more recent diversification within that West/Central African maternal pool, likely arising in the Late Holocene (on the order of a few thousand years ago) as populations in the region experienced localized expansions and social-networked maternal transmission.

Phylogenetically, L2B1A3 inherits the defining mutations of L2 and the downstream L2b and L2b1 subclades; its distinct set of derived variants separates it from sister branches of L2b1a. Because sampling density for deep African mtDNA diversity remains uneven, precise node dating and the full internal topology of L2B1A3 depend on expanded mitogenome sequencing, but available modern and ancient detections indicate a Holocene origin and a pattern of regional concentration with later dispersal events.

Subclades (if applicable)

At present, L2B1A3 appears to be a terminal or shallow clade in many published datasets, with limited clearly defined downstream branches published in the literature. Where internal substructure exists, it is usually resolved by full mitogenome sequencing from diverse West and Central African populations. As genomic sampling increases, researchers may identify further sub-branches within L2B1A3 that reflect local maternal lineages tied to specific ethnolinguistic groups or demographic events (for example, expansions associated with Iron Age social changes or later historic movements).

Geographical Distribution

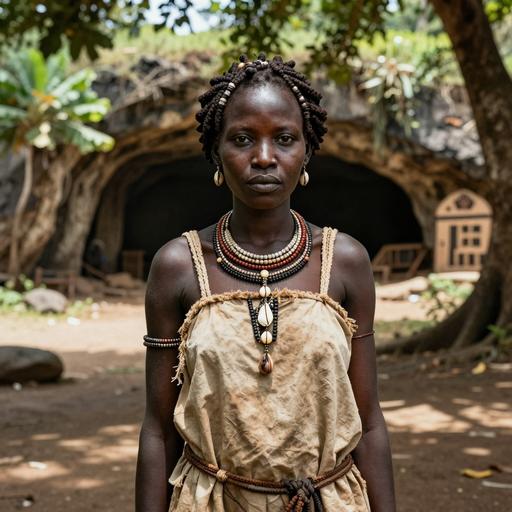
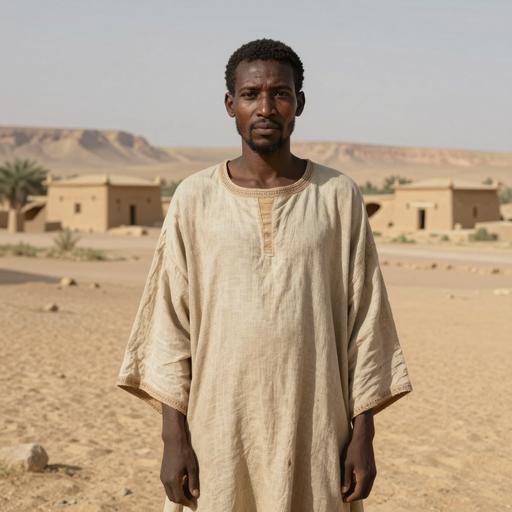
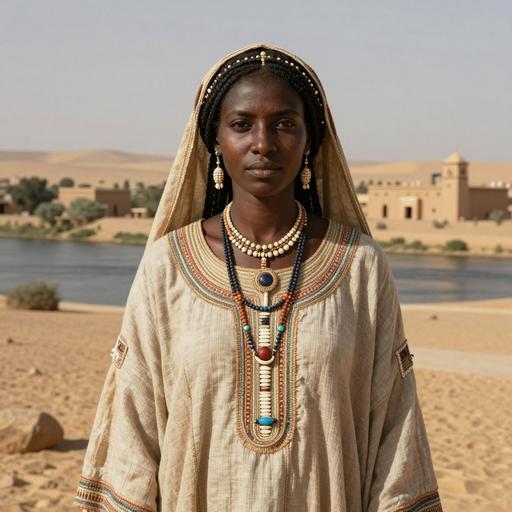
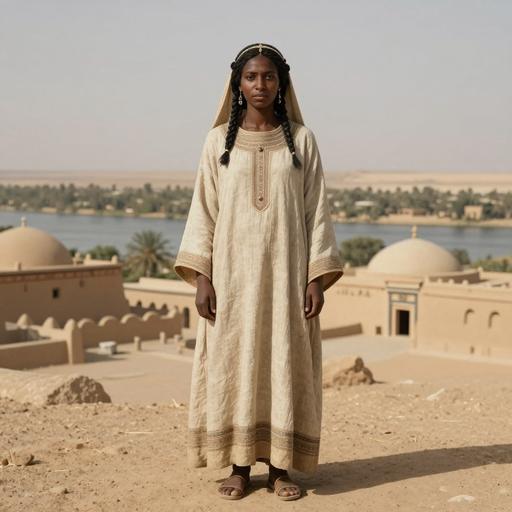
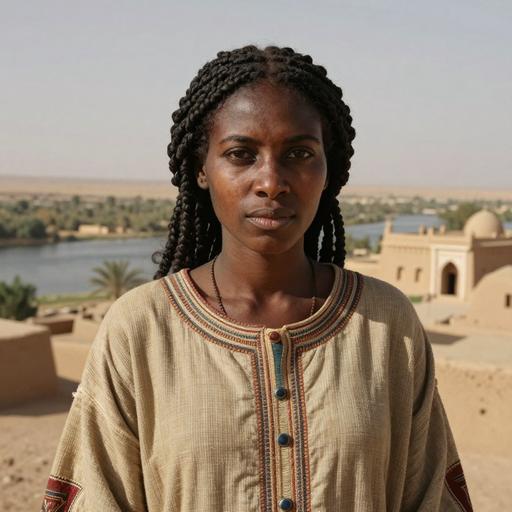
L2B1A3 is concentrated in West and Central Africa, with the highest frequencies observed in coastal West African groups and some Central African populations. Modern occurrences have been documented in Yoruba, Akan, Mande-speaking groups, Kongo and Bantu-speaking communities, and in Sahelian groups at lower frequencies. The haplogroup is also present in the African diaspora in the Americas and Atlantic islands as a legacy of trans-Atlantic forced migrations during the last 500 years. Low-frequency occurrences in North Africa and southern Europe generally reflect recent admixture rather than ancient back-migration.

Ancient DNA hits (several identified in regional Holocene and later contexts) confirm continuity of related L2b-derived lineages in West/Central Africa and provide direct archaeological links between modern distributions and past populations.

Historical and Cultural Significance

In population-genetic terms, L2B1A3 is informative about maternal ancestry in West and Central Africa and about the demographic processes that shaped those regions during the Holocene. Its distribution is consistent with:

  • Local Holocene population growths in coastal and riverine zones of West/Central Africa that produced differentiated maternal lineages.
  • The Bantu expansion, which redistributed many maternal lineages across Central, Eastern, and Southern Africa (L2-derived lineages are among those documented in some Bantu-speaking groups, although specific frequencies vary by subclade and region).
  • Historic dispersal via the Atlantic slave trade, which introduced West African maternal lineages, including L2b-derived clades, into the Americas and Atlantic island populations.

Archaeological cultures relevant to the broader dynamics of L2b1a-derived lineages include Iron Age and later regional cultural complexes (e.g., early farming/settled communities, Nok-era and later West African archaeological contexts) that correspond in time to diversification and regional structuring of maternal lineages.

Conclusion

L2B1A3 is a regional West/Central African maternal lineage derived from the L2b1a clade, reflecting Holocene diversification within African maternal gene pools and later historic movements that spread the lineage into the Atlantic diaspora. Continued mitogenome sampling, especially of underrepresented West and Central African groups and archaeological remains, will refine its internal structure, more precise age estimates, and finer-scale geographic patterning.

Key Points

  • Origins and Evolution
  • Subclades (if applicable)
  • Geographical Distribution
  • Historical and Cultural Significance
  • Conclusion
Chapter II

Tree & Relationships

Phylogenetic context and subclades

Evolution Path

This haplogroup's evolutionary journey from its earliest ancestor to the present.

Steps Haplogroup Age Estimate Archaeology Era Time Passed Immediate Descendants Tested Modern Descendants Ancient Connections
1 L2B1A3 Current ~4,000 years ago 🔶 Bronze Age 4,000 years 0 15 0
2 L2B1A ~7,000 years ago 🌾 Neolithic 7,000 years 1 35 7
3 L2B1 ~9,000 years ago 🌾 Neolithic 9,000 years 1 35 0
4 L2b ~25,000 years ago 🦴 Paleolithic 25,000 years 1 86 0
5 L1 ~120,000 years ago 🦴 Paleolithic 120,000 years 4 531 4
6 L ~160,000 years ago 🦴 Paleolithic 160,000 years 7 18,987 5

Subclades (0)

Terminal branch - no known subclades

Chapter III

Where in the World

Geographic distribution and modern presence

Place of Origin

West/Central Africa

Modern Distribution

The populations where mtDNA haplogroup L2B1A3 is found include:

  1. Yoruba (Nigeria, West Africa)
  2. Akan and other coastal Ghanaian groups (West Africa)
  3. Mande-speaking populations (Mali, Guinea; West Africa)
  4. Kongo and other Central African populations (Central Africa)
  5. Bantu-speaking groups in parts of Cameroon/Angola (Central/West Africa)
  6. Fulɓe / Fulani and Sahelian groups (West Africa) — lower/moderate frequencies
  7. Afro-Brazilian communities (Brazil, South America)
  8. African American and Afro-Caribbean populations (North America and Caribbean)
  9. Cape Verde and other Atlantic island populations with West African ancestry
  10. Low-frequency occurrences in North African and southern European populations due to recent admixture
CHAPTER IV

When in Time

Your haplogroup in the context of human history

~10k years ago

Neolithic Revolution

Agriculture begins, settled communities form

~5k years ago

Bronze Age

Metalworking, writing, and early civilizations

~4k years ago

Haplogroup L2B1A3

Your mtDNA haplogroup emerged in West/Central Africa

West/Central Africa
~3k years ago

Iron Age

Iron tools, expanded trade networks

~2k years ago

Classical Antiquity

Greek and Roman civilizations flourish

Present

Present Day

Modern era

Your Haplogroup
Historical Era
Chapter IV-B

Linked Cultures

Ancient cultures associated with mtDNA haplogroup L2B1A3

Cultural Heritage

These ancient cultures have been linked to haplogroup L2B1A3 based on matching ancient DNA samples from archaeological excavations. The presence of this haplogroup in these cultures provides insights into the migrations and population movements of populations carrying this haplogroup.

Corded Ware Jordanow-Michelsberg Culture Kansyore Culture Modern Period St. Helena Colonial Venosa
Culture assignments are based on archaeological context of ancient DNA samples and may represent regional associations during specific time periods.
Chapter V

Sample Catalog

Top 50 ancient DNA samples directly related to haplogroup L2B1A3 or parent clades

50 / 50 samples
Portrait Sample Country Era Date Culture mtDNA Match
Portrait of ancient individual KHO007 from Mongolia, dated 26 CE - 125 CE
KHO007
Mongolia Middle to Late Bronze Age to Xiongnu to Late Medieval Khovd, Mongolia 26 CE - 125 CE Khovd Long-Term L3 Direct
Portrait of ancient individual baa001 from South Africa, dated 38 BCE - 120 BCE
baa001
South Africa South Africa 1900 Years Before Present 38 BCE - 120 BCE Middle Iron Age L0d2c1 Direct
Portrait of ancient individual I13977 from Tanzania, dated 47 BCE - 113 BCE
I13977
Tanzania Prehistoric in Tanzania 47 BCE - 113 BCE Tanzanian Prehistoric L0f2a1 Direct
Portrait of ancient individual I13970 from Tanzania, dated 50 BCE - 60 BCE
I13970
Tanzania Prehistoric in Tanzania 50 BCE - 60 BCE Tanzanian Prehistoric L3h1a2a1 Direct
Portrait of ancient individual I15499 from Serbia, dated 80 CE - 215 CE
I15499
Serbia Roman Serbia 80 CE - 215 CE Roman Provincial L2a1j Direct
Portrait of ancient individual NEV020 from Turkey, dated 80 CE - 227 CE
NEV020
Turkey Nevalı Çori Roman Period 80 CE - 227 CE Nevalı Çori Culture L2a1+143+@16309 Direct
Portrait of ancient individual I8808 from Kenya, dated 84 BCE - 211 BCE
I8808
Kenya Late Stone Age in Kenya 84 BCE - 211 BCE LSA Kenya L4b2a2c Direct
Portrait of ancient individual UCT386 from South Africa, dated 88 BCE - 202 BCE
UCT386
South Africa South Africa 1900 Years Before Present 88 BCE - 202 BCE Middle Iron Age L0d1b2b1b Direct
Portrait of ancient individual UCT386 from South Africa, dated 88 BCE - 202 BCE
UCT386
South Africa Ancient South Africa 88 BCE - 202 BCE L0d1b2b1b Direct
Portrait of ancient individual I10719 from Kenya, dated 91 BCE - 24 BCE
I10719
Kenya Pastoral Neolithic Elmenteitan in Kenya 91 BCE - 24 BCE Elmenteitan Culture L3h1a2a1 Direct
Chapter VI

Carrier Distribution Map

Geographic distribution of 100 ancient DNA samples carrying haplogroup L2B1A3

Time Period Filter
All Time Periods
Showing all samples
Each marker represents an ancient individual
Chapter VII

Temporal Distribution

Distribution of carriers across archaeological periods

Chapter VIII

Geographic Distribution

Distribution of carriers by country of origin

Chapter IX

Country × Era Distribution

Cross-tabulation of carrier countries and archaeological periods

Data

Data & Provenance

Source information and data quality

Last Updated 2026-02-16
Confidence Score 50/100
Coverage Low
Data Source

We use the latest phylotree for MTDNA haplogroup classification and data.