Menu
mtDNA Haplogroup • Maternal Lineage

N3

mtDNA Haplogroup N3

~28,000 years ago
Near East / West Asia
1 subclades
Scroll to explore
Chapter I

The Story

The journey of mtDNA haplogroup N3

Origins and Evolution

mtDNA haplogroup N3 is a derived lineage within macro-haplogroup N, which itself radiated shortly after the Out-of-Africa dispersal. Based on phylogenetic position and molecular-clock estimates for similar N subclades, N3 most likely arose in the Near East or adjacent West Asian corridors during the Upper Paleolithic (roughly ~25–35 kya). As a subclade of N, N3 shares deep maternal ancestry with many Eurasian lineages, but it represents a more localized branch whose diversity and geographic footprint were shaped by subsequent founder events, drift, and Holocene demographic processes.

Subclades

N3 contains internal branching that is detected in modern sequence databases and in some ancient samples; these subclades often show geographically restricted patterns (for example, variants more common in the Caucasus or in parts of Iran and the Levant). Because N3 is relatively uncommon, many of its internal branches are low-frequency and can be strongly affected by local founder effects. Continued high-resolution mitogenome sequencing is expanding the catalog of N3 sublineages and improving age estimates and phylogeographic reconstructions.

Geographical Distribution

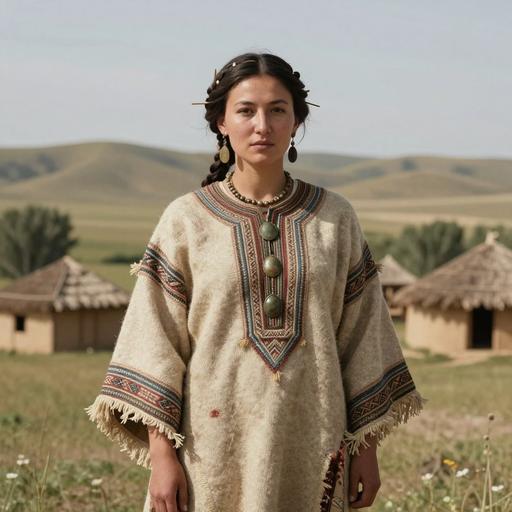
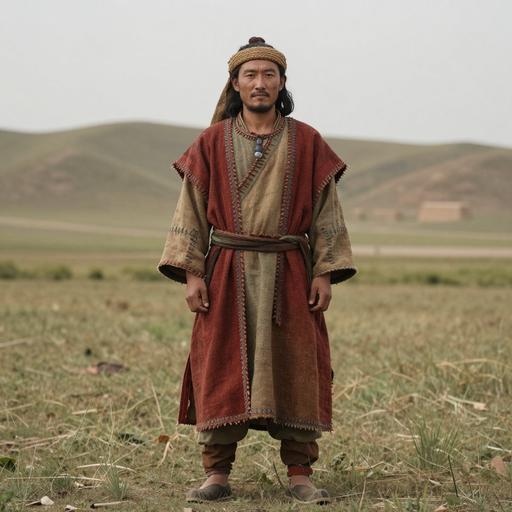
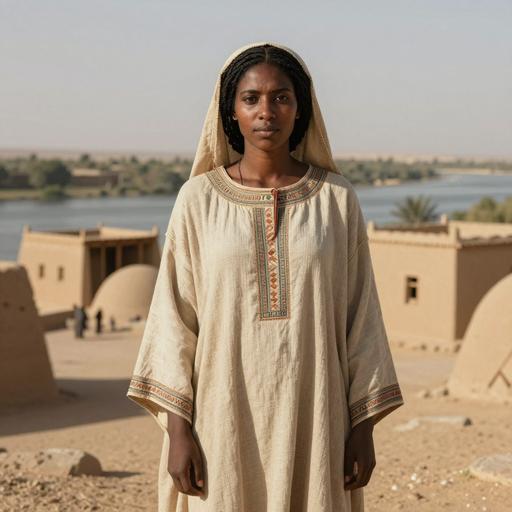
Today, N3 is principally detected at low-to-moderate frequencies across the Near East and the Caucasus, with scattered occurrences in South Asia (particularly in northwest South Asian groups), parts of the eastern Mediterranean and at low frequency in some European and North African populations. The pattern is consistent with an Upper Paleolithic origin in West Asia followed by long-term regional continuity punctuated by later migrations (Neolithic farmer expansions, Bronze Age movements, and historic-era gene flow) that redistributed low-frequency maternal lineages across West Eurasia.

Historical and Cultural Significance

Because N3 is neither highly frequent nor geographically concentrated like some other maternal haplogroups, its primary value is in fine-scale phylogeography and ancient-DNA contexts rather than as a marker of a single large migration. When N3 (and its subclades) appears in ancient remains, it can contribute to reconstructing maternal ancestries of regional hunter-gatherer groups, early farmers of the Near East and Anatolia, and subsequent Holocene populations. N3 lineages in the Caucasus and Iran likely reflect long-standing maternal continuity in mountainous and semi-arid regions that served as refugia and contact zones between Europe, the Near East and South Asia.

Conclusion

mtDNA haplogroup N3 is a modestly diverse but low-frequency West Eurasian branch of macro-haplogroup N with an Upper Paleolithic origin in the Near East/West Asia. Its distribution emphasizes regional continuity in the Caucasus and Near East with sporadic spread into neighboring regions via later Neolithic, Bronze Age, and historic movements. Ongoing whole-mitogenome sequencing and ancient DNA sampling continue to refine the internal structure, age estimates, and migration history of this lineage.

Key Points

  • Origins and Evolution
  • Subclades
  • Geographical Distribution
  • Historical and Cultural Significance
  • Conclusion
Chapter II

Tree & Relationships

Phylogenetic context and subclades

Evolution Path

This haplogroup's evolutionary journey from its earliest ancestor to the present.

Steps Haplogroup Age Estimate Archaeology Era Time Passed Immediate Descendants Tested Modern Descendants Ancient Connections
1 N3 Current ~28,000 years ago 🦴 Paleolithic 28,000 years 1 4 0
2 N ~60,000 years ago 🦴 Paleolithic 60,000 years 15 15,452 13
3 L3 ~70,000 years ago 🦴 Paleolithic 70,000 years 11 17,621 6
4 L ~160,000 years ago 🦴 Paleolithic 160,000 years 7 18,987 5
Chapter III

Where in the World

Geographic distribution and modern presence

Place of Origin

Near East / West Asia

Modern Distribution

The populations where mtDNA haplogroup N3 is found include:

  1. Levantine and Near Eastern populations (e.g., Lebanon, Syria)
  2. Caucasus groups (e.g., Armenians, Georgians)
  3. Anatolian and Turkish populations
  4. Iranian plateau populations and southwestern Asia (Iran, Iraq)
  5. Northwest South Asian groups (Pakistan, northwestern India)
  6. Eastern Mediterranean coastal populations (Greece, Cyprus) at low frequency
  7. North African populations (low frequency, often due to historic/ancient gene flow)
  8. Central Asian and Transcaucasian groups (sporadic occurrences)
  9. Some Jewish communities with Near Eastern maternal ancestries (occasional lineages)
  10. Ancient Near Eastern and Anatolian Neolithic and later archaeological remains (ancient DNA contexts)
CHAPTER IV

When in Time

Your haplogroup in the context of human history

~28k years ago

Haplogroup N3

Your mtDNA haplogroup emerged in Near East / West Asia

Near East / West Asia
~20k years ago

Last Glacial Maximum

Peak of the last ice age, populations isolated

~10k years ago

Neolithic Revolution

Agriculture begins, settled communities form

~5k years ago

Bronze Age

Metalworking, writing, and early civilizations

~3k years ago

Iron Age

Iron tools, expanded trade networks

~2k years ago

Classical Antiquity

Greek and Roman civilizations flourish

Present

Present Day

Modern era

Your Haplogroup
Historical Era
Chapter IV-B

Linked Cultures

Ancient cultures associated with mtDNA haplogroup N3

Cultural Heritage

These ancient cultures have been linked to haplogroup N3 based on matching ancient DNA samples from archaeological excavations. The presence of this haplogroup in these cultures provides insights into the migrations and population movements of populations carrying this haplogroup.

Bohemian Hunter-Gatherer Buran-Kaya Byzantine Anatolia Corded Ware Dzudzuana Early Avar Early Bronze Anatolia Funnel Beaker Culture Hetian Culture Iraqi PPN Peștera cu Oase Venosa Welsh Neolithic
Culture assignments are based on archaeological context of ancient DNA samples and may represent regional associations during specific time periods.
Chapter V

Sample Catalog

Top 50 ancient DNA samples directly related to haplogroup N3 or parent clades

50 / 50 samples
Portrait Sample Country Era Date Culture mtDNA Match
Portrait of ancient individual C391 from China, dated 1 CE - 400 CE
C391
China Historical Period Hetian, Xinjiang, China 1 CE - 400 CE Hetian Culture N Direct
Portrait of ancient individual ZLNR-1 from China, dated 81 CE - 236 CE
ZLNR-1
China Iron Age China 81 CE - 236 CE Chinese Iron Age N9a9 Direct
Portrait of ancient individual ZLNR-1 from China, dated 81 CE - 236 CE
ZLNR-1
China Iron Age China 81 CE - 236 CE N9a9 Direct
Portrait of ancient individual I16584 from Turkey, dated 100 BCE - 200 CE
I16584
Turkey Roman Period 2 Turkey 100 BCE - 200 CE Middle Roman Anatolia N1a1b1 Direct
Portrait of ancient individual PCA0480 from Poland, dated 100 CE - 300 CE
PCA0480
Poland Wielbark Culture 100 CE - 300 CE Wielbark N1b1b Direct
Portrait of ancient individual DA39 from Mongolia, dated 150 BCE - 125 CE
DA39
Mongolia Xiongnu Period Mongolia 150 BCE - 125 CE Xiongnu Culture N9a2'4'5'11 Direct
Portrait of ancient individual DA39 from Mongolia, dated 150 BCE - 125 CE
DA39
Mongolia The Xiongnu Empire 150 BCE - 125 CE N9a2'4'5'11 Direct
Portrait of ancient individual SFI-11 from Lebanon, dated 151 BCE - 62 CE
SFI-11
Lebanon Early Roman Lebanon 151 BCE - 62 CE Early Roman Lebanese N1b1 Direct
Portrait of ancient individual SFI-11 from Lebanon, dated 151 BCE - 62 CE
SFI-11
Lebanon Roman Levant 151 BCE - 62 CE N1b1 Direct
Portrait of ancient individual IMA008 from Russia, dated 200 BCE - 100 CE
IMA008
Russia Xiongnu Period Buryatia, Russia 200 BCE - 100 CE Xiongnu Buryat N9a Direct
Chapter VI

Carrier Distribution Map

Geographic distribution of 100 ancient DNA samples carrying haplogroup N3

Time Period Filter
All Time Periods
Showing all samples
Each marker represents an ancient individual
Chapter VII

Temporal Distribution

Distribution of carriers across archaeological periods

Chapter VIII

Geographic Distribution

Distribution of carriers by country of origin

Chapter IX

Country × Era Distribution

Cross-tabulation of carrier countries and archaeological periods

Data

Data & Provenance

Source information and data quality

Last Updated 2026-02-16
Confidence Score 50/100
Coverage Low
Data Source

We use the latest phylotree for MTDNA haplogroup classification and data.