Menu
mtDNA Haplogroup • Maternal Lineage

U1A1A3

mtDNA Haplogroup U1A1A3

~7,000 years ago
Near East / Caucasus
0 subclades
Scroll to explore
Chapter I

The Story

The journey of mtDNA haplogroup U1A1A3

Origins and Evolution

mtDNA haplogroup U1A1A3 is a downstream subclade of U1A1A within the broader U1 branch of haplogroup U. U1 as a whole is a West Eurasian maternal lineage with roots that extend into the Upper Paleolithic and Mesolithic, while U1A1A emerged in the early Holocene in the Near East/Caucasus region. U1A1A3 represents a more terminal branch that likely differentiated from other U1A1A lineages during the mid-to-late Holocene (a few thousand years after the initial U1A1A split), carrying a small number of defining mutations that mark it within the U1 phylogeny.

Because U1A1A3 is nested beneath a lineage known to be associated with early Holocene Near Eastern populations, its origin is most parsimoniously placed in the Near East/Caucasus where maternal diversity of U1 is relatively high and where archaeological evidence documents long-term continuity and population structure through the Neolithic and later periods.

Subclades (if applicable)

U1A1A3 is itself a terminal or near-terminal subclade in many modern sampling studies; published phylogenies and population surveys often show U1A1A breaking into several geographically localized daughter lineages, of which U1A1A3 is one. As a relatively derived branch, U1A1A3 may contain further very-low-frequency local subbranches in specific populations (for example, regional lineages in parts of the Caucasus or western South Asia) but, in many datasets, it appears as a discrete clade without widely distributed downstream diversity.

Geographical Distribution

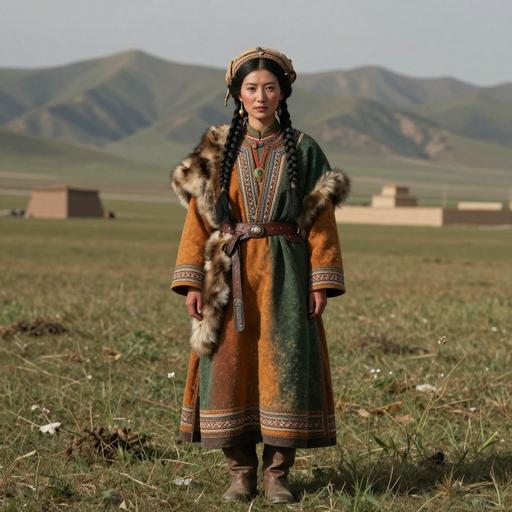
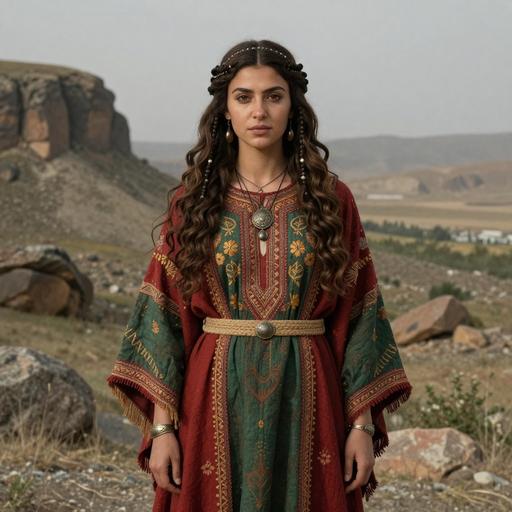
The distribution of U1A1A3 mirrors that of its parent clade but is typically more restricted and patchy. It is most frequently observed at low-to-moderate frequencies in:

  • The Near East (including parts of Iran, Anatolia/Turkey, and the Levant)
  • The Caucasus (Armenia, Georgia and adjacent groups)
  • Parts of South Asia (India and Pakistan) at low frequencies, likely reflecting Holocene-era gene flow from West Asia

Sporadic occurrences are also recorded in North Africa and southern/eastern Europe, usually at very low frequencies and plausibly reflecting historic or prehistoric westward and Mediterranean gene flow. Ancient DNA hits for closely related U1A1A lineages in Holocene archaeological contexts support a long-standing presence of these maternal lineages in West Asia and the Caucasus.

Historical and Cultural Significance

While U1A1A3 is not a high-frequency marker tied to any single expansive archaeological culture, its presence is consistent with demographic processes that shaped the Near East and adjacent regions in the early Holocene:

  • Neolithic farmer expansions from the Fertile Crescent carried a mosaic of maternal lineages, including branches of U1, into neighboring regions. U1A1A3 likely reflects part of this Neolithic-era demographic substrate in West Asia and nearby areas.
  • Regional continuity in the Caucasus and parts of Iran: the persistence of U1-derived lineages through the Chalcolithic and Bronze Age in localized populations suggests continuity of maternal lineages in mountainous and sheltered regions where small-scale societies maintained genetic continuity through time.
  • Low-frequency westward and southward gene flow: scatterings of U1A1A3 or related lineages into southern Europe, North Africa, and South Asia are compatible with multiple episodes of mobility (Neolithic, Bronze Age trade/migration, and historic movements).

Conclusion

U1A1A3 is best interpreted as a localized, derived maternal lineage that arose within the Near Eastern/Caucasus genetic landscape in the Holocene and subsequently remained at low-to-moderate frequencies across a contiguous region spanning West Asia, the Caucasus and parts of South Asia. It provides useful resolution for studies of regional maternal continuity and fine-scale Holocene population structure, but because it is relatively rare and geographically patchy, broad-scale demographic inferences should be made cautiously and in combination with complementary genetic, archaeological and linguistic evidence.

Key Points

  • Origins and Evolution
  • Subclades (if applicable)
  • Geographical Distribution
  • Historical and Cultural Significance
  • Conclusion
Chapter II

Tree & Relationships

Phylogenetic context and subclades

Evolution Path

This haplogroup's evolutionary journey from its earliest ancestor to the present.

Steps Haplogroup Age Estimate Archaeology Era Time Passed Immediate Descendants Tested Modern Descendants Ancient Connections
1 U1A1A3 Current ~7,000 years ago 🌾 Neolithic 7,000 years 0 12 0
2 U1A1A ~9,000 years ago 🌾 Neolithic 9,000 years 3 37 26
3 U1A1 ~12,000 years ago 🌾 Neolithic 12,000 years 3 53 0
4 U1A ~17,000 years ago 🏹 Mesolithic 17,000 years 4 60 29
5 U1 ~28,000 years ago 🦴 Paleolithic 28,000 years 2 79 0
6 U ~46,000 years ago 🦴 Paleolithic 46,000 years 12 2,835 110
7 R ~60,000 years ago 🦴 Paleolithic 60,000 years 12 10,987 57
8 N ~60,000 years ago 🦴 Paleolithic 60,000 years 15 15,452 13
9 L3 ~70,000 years ago 🦴 Paleolithic 70,000 years 11 17,621 6
10 L ~160,000 years ago 🦴 Paleolithic 160,000 years 7 18,987 5

Subclades (0)

Terminal branch - no known subclades

Siblings (2)

Other branches from the same parent haplogroup

Chapter III

Where in the World

Geographic distribution and modern presence

Place of Origin

Near East / Caucasus

Modern Distribution

The populations where mtDNA haplogroup U1A1A3 is found include:

  1. Populations of the Near East (e.g., Iran, Levant, Turkey)
  2. Caucasus populations (e.g., Armenians, Georgians, neighboring groups)
  3. South Asian populations (India and Pakistan, at low-to-moderate frequencies)
  4. North African groups (sporadic presence, including some Berber populations)
  5. Southern and Eastern European populations (low-frequency, often reflecting westward gene flow)
  6. Jewish populations (sporadic presence in some community studies)
  7. Small or localized groups showing regional continuity in West Asia and adjacent areas
CHAPTER IV

When in Time

Your haplogroup in the context of human history

~10k years ago

Neolithic Revolution

Agriculture begins, settled communities form

~7k years ago

Haplogroup U1A1A3

Your mtDNA haplogroup emerged in Near East / Caucasus

Near East / Caucasus
~5k years ago

Bronze Age

Metalworking, writing, and early civilizations

~3k years ago

Iron Age

Iron tools, expanded trade networks

~2k years ago

Classical Antiquity

Greek and Roman civilizations flourish

Present

Present Day

Modern era

Your Haplogroup
Historical Era
Chapter IV-B

Linked Cultures

Ancient cultures associated with mtDNA haplogroup U1A1A3

Cultural Heritage

These ancient cultures have been linked to haplogroup U1A1A3 based on matching ancient DNA samples from archaeological excavations. The presence of this haplogroup in these cultures provides insights into the migrations and population movements of populations carrying this haplogroup.

Anatolian Geometric British Late Bronze Age Byzantine Culture Canaanite Copper Age Italy Early Bronze Age Armenian French Neolithic Hagios Charalambos Culture Kilteasheen Koukounaries Culture North Caucasus Culture Sardinian Neolithic Shahr-i Sokhta Culture Tisza
Culture assignments are based on archaeological context of ancient DNA samples and may represent regional associations during specific time periods.
Chapter V

Sample Catalog

Top 50 ancient DNA samples directly related to haplogroup U1A1A3 or parent clades

50 / 50 samples
Portrait Sample Country Era Date Culture mtDNA Match
Portrait of ancient individual R114 from Italy, dated 1 CE - 200 CE
R114
Italy Imperial Rome 1 CE - 200 CE Roman Empire U1b1 Direct
Portrait of ancient individual R115 from Italy, dated 1 CE - 200 CE
R115
Italy Imperial Rome 1 CE - 200 CE Roman Empire U4 Direct
Portrait of ancient individual R116 from Italy, dated 1 CE - 200 CE
R116
Italy Imperial Rome 1 CE - 200 CE Roman Empire U3a2c* Direct
Portrait of ancient individual R436 from Italy, dated 1 CE - 200 CE
R436
Italy Imperial Rome 1 CE - 200 CE Roman Empire U5b3a Direct
Portrait of ancient individual R45 from Italy, dated 1 CE - 400 CE
R45
Italy Imperial Rome 1 CE - 400 CE Roman Empire U3b1 Direct
Portrait of ancient individual R51 from Italy, dated 1 CE - 400 CE
R51
Italy Imperial Rome 1 CE - 400 CE Roman Empire U3b1 Direct
Portrait of ancient individual KD042 from United Kingdom, dated 1 CE - 250 CE
KD042
United Kingdom Iron Age Orkney, Scotland 1 CE - 250 CE Orcadian Iron Age U5a1b1a Direct
Portrait of ancient individual VK532 from Denmark, dated 1 CE - 200 CE
VK532
Denmark Iron Age Denmark 1 CE - 200 CE Danish Iron Age U2e2a1 Direct
Portrait of ancient individual I15514 from Serbia, dated 1 CE - 400 CE
I15514
Serbia Roman Serbia 1 CE - 400 CE Roman Provincial U4a2a Direct
Portrait of ancient individual I15536 from Serbia, dated 1 CE - 400 CE
I15536
Serbia Roman Serbia 1 CE - 400 CE Roman Provincial U5a1j Direct
Chapter VI

Carrier Distribution Map

Geographic distribution of 100 ancient DNA samples carrying haplogroup U1A1A3

Time Period Filter
All Time Periods
Showing all samples
Each marker represents an ancient individual
Chapter VII

Temporal Distribution

Distribution of carriers across archaeological periods

Chapter VIII

Geographic Distribution

Distribution of carriers by country of origin

Chapter IX

Country × Era Distribution

Cross-tabulation of carrier countries and archaeological periods

Data

Data & Provenance

Source information and data quality

Last Updated 2026-02-16
Confidence Score 50/100
Coverage Low
Data Source

We use the latest phylotree for MTDNA haplogroup classification and data.