Menu
Y-DNA Haplogroup • Paternal Lineage

O1A1A

Y-DNA Haplogroup O1A1A

~4,000 years ago
Southern China / Taiwan
1 subclades
Scroll to explore
Chapter I

The Story

The journey of Y-DNA haplogroup O1A1A

Origins and Evolution

Haplogroup O1A1A is a downstream branch of the broader O1a (M119) lineage, which is characteristic of coastal East and Southeast Asian populations. O1a lineages are widely interpreted in population genetics as having diversified in southern China and Taiwan during the early Holocene, with later pulses connected to the Neolithic and post-Neolithic maritime expansions. O1A1A most likely arose after the initial diversification of O1A1 (estimated ~9 kya for O1A1) and its timing and distribution are consistent with splits that predate or coincide with the Austronesian dispersal from Taiwan into the Philippines, Island Southeast Asia and the Pacific (roughly 4–3 kya).

Subclades (if applicable)

As a defined downstream clade of O1A1, O1A1A can itself include multiple regionally differentiated lineages detected in high-resolution Y-SNP studies and Y-STR clustering. Where fine-scale phylogenies are available, O1A1A subbranches sometimes show geographic structuring — for example, lineages concentrated in Taiwan and northern Philippines versus those more frequent in eastern Indonesia and western Melanesia — reflecting serial founder effects and maritime founder events during Austronesian expansions. Continued targeted sequencing and SNP discovery (including high-coverage Y-chromosome sequencing of Austronesian-speaking groups) refines relationships and reveals younger subclades tied to island-to-island colonization patterns.

Geographical Distribution

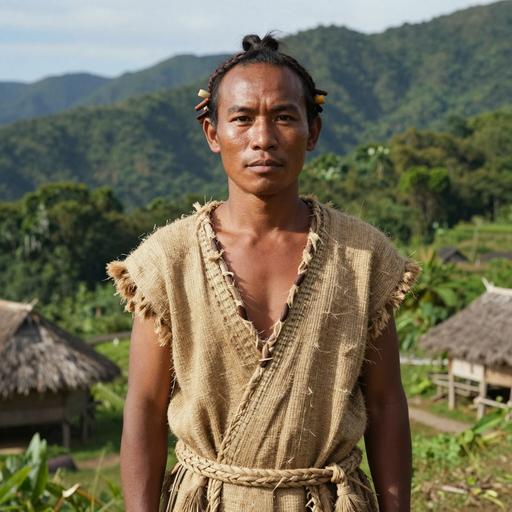
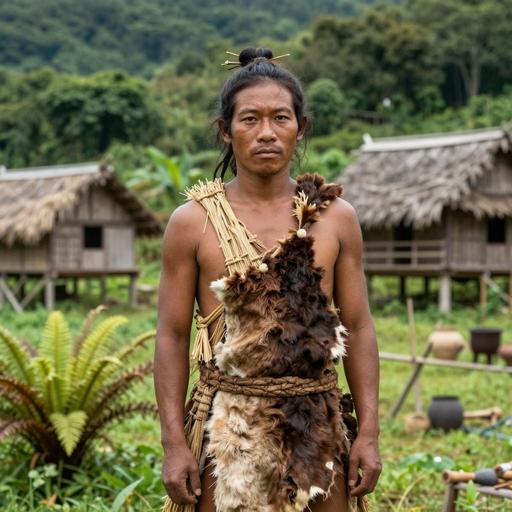
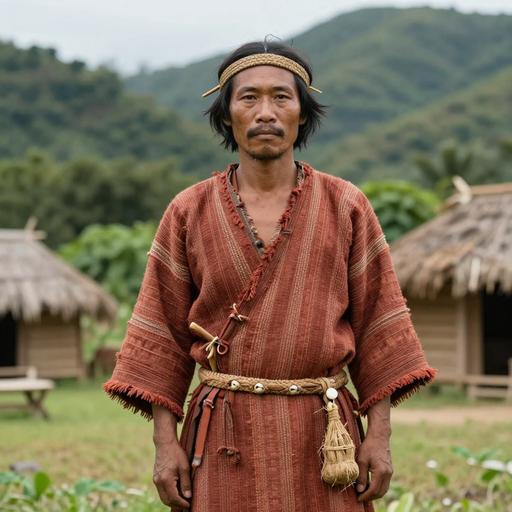
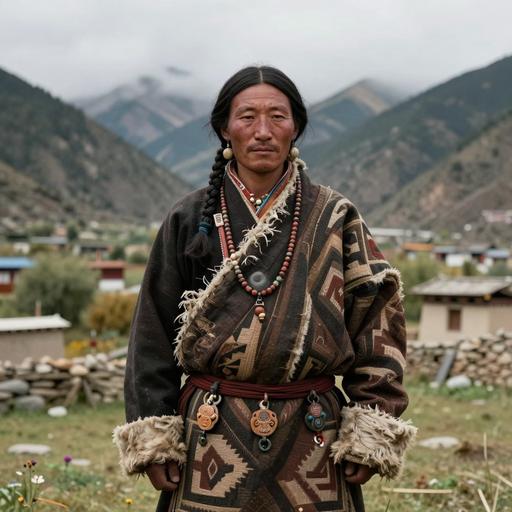
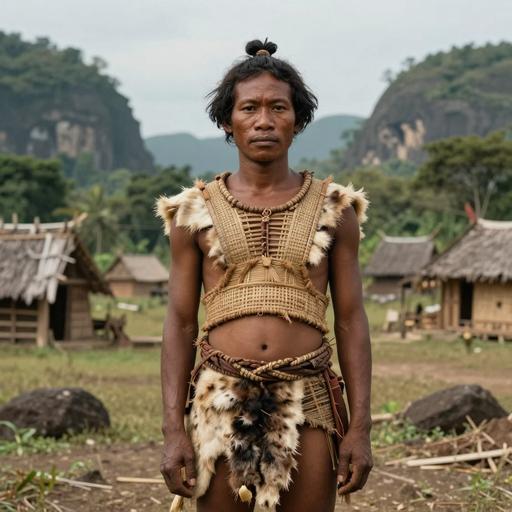
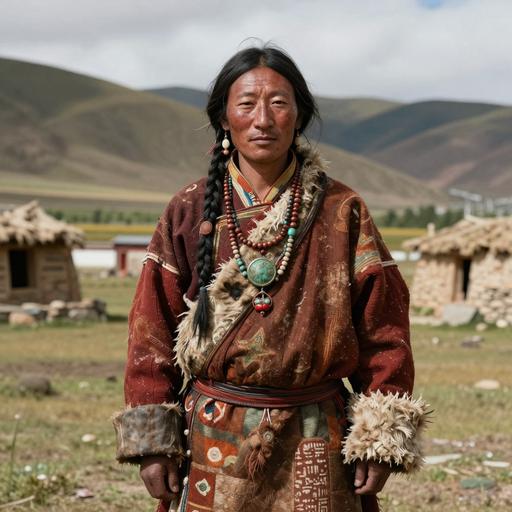
O1A1A is primarily coastal and island-distributed rather than inland: it is found at high frequencies among many indigenous Taiwanese groups and in parts of the northern Philippines, with moderate presence in broader Island Southeast Asia (Borneo, Sulawesi, parts of Indonesia and Malaysia) and detectable but lower frequencies in coastal southern China (Fujian, Guangdong). It also appears at moderate-to-low frequencies in some Pacific island populations that derive from Austronesian/Lapita expansions, and as occasional low-frequency occurrences in mainland Southeast Asia and coastal South Asia due to historic gene flow.

Historical and Cultural Significance

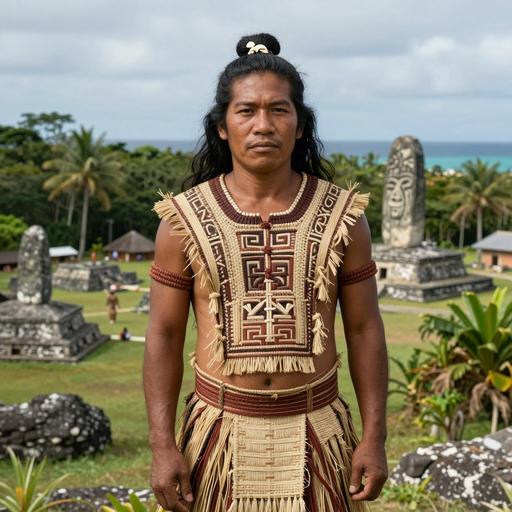
Genetic patterns for O1A1A align closely with archaeological and linguistic reconstructions of the Austronesian expansion. The lineage is frequently associated with Neolithic farming populations in Taiwan (early Holocene Neolithic groups such as Dapenkeng/Pre-Austronesian cultural horizons) and with downstream maritime cultures like the Lapita complex that played a key role in the settlement of Remote Oceania. In modern populations, O1A1A complements maternal lineages such as mtDNA B4a1a (the Polynesian motif) in populations shaped by long-range oceanic migration, and its presence helps trace male-mediated movements of Austronesian-speaking peoples during the Holocene.

Conclusion

O1A1A is a regionally informative Y-chromosome lineage for reconstructing Holocene coastal demographic processes in East and Southeast Asia and the Pacific. Its phylogenetic position and geographic distribution support a southern China/Taiwan origin with expansion into Island Southeast Asia and the Pacific during the Austronesian maritime dispersals; ongoing high-resolution Y-chromosome sequencing and broader population sampling continue to refine its internal structure and migration history.

Key Points

  • Origins and Evolution
  • Subclades (if applicable)
  • Geographical Distribution
  • Historical and Cultural Significance
  • Conclusion
Chapter II

Tree & Relationships

Phylogenetic context and subclades

Evolution Path

This haplogroup's evolutionary journey from its earliest ancestor to the present.

Steps Haplogroup Age Estimate Archaeology Era Time Passed Immediate Descendants Tested Modern Descendants Ancient Connections
1 O1A1A Current ~4,000 years ago 🔶 Bronze Age 4,500 years 1 13 0
Chapter III

Where in the World

Geographic distribution and modern presence

Place of Origin

Southern China / Taiwan

Modern Distribution

The populations where Y-DNA haplogroup O1A1A is found include:

  1. Indigenous Taiwanese (Austronesian-speaking groups such as Amis, Atayal, Paiwan)
  2. Indigenous and lowland populations of the northern Philippines (e.g., Ivatan, some Tagalog and Visayan groups)
  3. Coastal southern Chinese populations (notably Fujianese and some Guangdong coastal groups)
  4. Island Southeast Asian populations (e.g., parts of Indonesia, Malaysia, Borneo, Sulawesi)
  5. Pacific islanders associated with Austronesian and Lapita-derived populations (including some Polynesian lineages)
  6. Mainland Southeast Asian groups at lower frequencies (Vietnamese, Thai) and rare occurrences in coastal South Asia and parts of Japan/Korea

Regional Presence

Southeast Asia High
Eastern Asia (Southern China & Taiwan) High
Oceania / Pacific Islands Moderate
Northeast Asia (Japan/Korea) Low
South Asia (coastal) Low
CHAPTER IV

When in Time

Your haplogroup in the context of human history

~10k years ago

Neolithic Revolution

Agriculture begins, settled communities form

~5k years ago

Bronze Age

Metalworking, writing, and early civilizations

~4k years ago

Haplogroup O1A1A

Your Y-DNA haplogroup emerged in Southern China / Taiwan

Southern China / Taiwan
~3k years ago

Iron Age

Iron tools, expanded trade networks

~2k years ago

Classical Antiquity

Greek and Roman civilizations flourish

Present

Present Day

Modern era

Your Haplogroup
Historical Era
Chapter IV-B

Linked Cultures

Ancient cultures associated with Y-DNA haplogroup O1A1A

Cultural Heritage

These ancient cultures have been linked to haplogroup O1A1A based on matching ancient DNA samples from archaeological excavations. The presence of this haplogroup in these cultures provides insights into the migrations and population movements of populations carrying this haplogroup.

Chinese Island Southeast Asian Culture
Culture assignments are based on archaeological context of ancient DNA samples and may represent regional associations during specific time periods.
Chapter V

Sample Catalog

Top 50 ancient DNA samples directly related to haplogroup O1A1A or parent clades

50 / 50 samples
Portrait Sample Country Era Date Culture Y-DNA Match
Portrait of ancient individual I3736 from Taiwan, dated 1 CE - 800 CE
I3736
Taiwan Iron Age Taiwan 1 CE - 800 CE Taiwanese Iron O1a1a1a1-CTS1711 Direct
Portrait of ancient individual I3614 from Taiwan, dated 1 CE - 800 CE
I3614
Taiwan Iron Age Taiwan 1 CE - 800 CE Taiwanese Iron O2a2b2-CTS1366 Direct
Portrait of ancient individual I3618 from Taiwan, dated 1 CE - 800 CE
I3618
Taiwan Iron Age Taiwan 1 CE - 800 CE Taiwanese Iron O2a2b2a2-F706 Direct
Portrait of ancient individual I3731 from Taiwan, dated 1 CE - 800 CE
I3731
Taiwan Iron Age Taiwan 1 CE - 800 CE Taiwanese Iron O1a1a1a1-CTS1711 Direct
Portrait of ancient individual I8076 from Taiwan, dated 1 CE - 800 CE
I8076
Taiwan Iron Age Taiwan 1 CE - 800 CE Taiwanese Iron O-M119 Direct
Portrait of ancient individual I8080 from Taiwan, dated 1 CE - 800 CE
I8080
Taiwan Iron Age Taiwan 1 CE - 800 CE Taiwanese Iron O1a1a1a-F518 Direct
Portrait of ancient individual I14933 from Taiwan, dated 1 CE - 800 CE
I14933
Taiwan Iron Age Taiwan 1 CE - 800 CE Taiwanese Iron O1a2-F1081 Direct
Portrait of ancient individual I14931 from Taiwan, dated 1 CE - 800 CE
I14931
Taiwan Iron Age Taiwan 1 CE - 800 CE Taiwanese Iron O2a2-P201 Direct
Portrait of ancient individual I14929 from Taiwan, dated 1 CE - 800 CE
I14929
Taiwan Iron Age Taiwan 1 CE - 800 CE Taiwanese Iron O2a2b-F130 Direct
Portrait of ancient individual I14934 from Taiwan, dated 1 CE - 800 CE
I14934
Taiwan Iron Age Taiwan 1 CE - 800 CE Taiwanese Iron O1a1a1a1-CTS10963 Direct
Chapter VI

Carrier Distribution Map

Geographic distribution of 100 ancient DNA samples carrying haplogroup O1A1A

Time Period Filter
All Time Periods
Showing all samples
Each marker represents an ancient individual
Chapter VII

Temporal Distribution

Distribution of carriers across archaeological periods

Chapter VIII

Geographic Distribution

Distribution of carriers by country of origin

Chapter IX

Country × Era Distribution

Cross-tabulation of carrier countries and archaeological periods

Data

Data & Provenance

Source information and data quality

Last Updated 2026-02-16
Confidence Score 50/100
Coverage Low
Data Source

We use the latest phylotree for YDNA haplogroup classification and data.