Menu
Y-DNA Haplogroup • Paternal Lineage

O1A1

Y-DNA Haplogroup O1A1

~9,000 years ago
Southern China / Taiwan
1 subclades
Scroll to explore
Chapter I

The Story

The journey of Y-DNA haplogroup O1A1

Origins and Evolution

Y-DNA haplogroup O1A1 sits within the broader O1A (M119) branch of haplogroup O, a lineage that is strongly linked to southern East Asian and Austronesian-speaking populations. Based on its phylogenetic position beneath O1A and patterns of geographic diversity, O1A1 likely arose in the southern China / Taiwan region during the early Holocene (roughly ~9 kya estimated divergence). Its emergence reflects post-glacial population differentiation along coastal East Asia, followed by demographic processes tied to the Neolithic and later maritime dispersals.

Genetic studies show that O1A lineages display deep diversity in Taiwan and the northern Philippines, with derived subclades such as O1A1 representing regional expansions and founder effects associated with seafaring populations. The timing and geographic pattern are consistent with a scenario of initial diversification in coastal southern China/Taiwan, with subsequent spread into Island Southeast Asia during the mid-to-late Holocene.

Subclades

O1A1 contains internal structure (regional subclades) that are detectable with high-resolution SNP-based Y-chromosome sequencing and dense regional sampling. Some sub-lineages are geographically concentrated (for example, island-specific or archipelago-specific branches in the Philippines, eastern Indonesia, and western Micronesia), reflecting founder events and serial bottlenecks during island colonization. High-resolution nomenclature continues to evolve as more ancient and modern genomes are sequenced; researchers typically find a pattern of deep Taiwanese/northern Philippine diversity with derived branch points shared by many Island Southeast Asian and Pacific populations.

Geographical Distribution

Haplogroup O1A1 is most frequent and diverse in the Taiwan–northern Philippines region and in coastal southern China, and it is present at lower but notable frequencies across Island Southeast Asia and into parts of Polynesia. Typical geographic observations include:

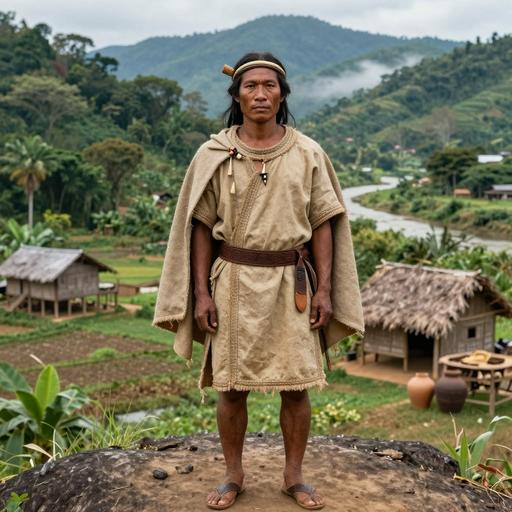
  • High diversity and frequency among indigenous Austronesian-speaking groups in Taiwan and the northern Philippines.
  • Elevated frequencies in some coastal southern Chinese populations (e.g., Fujian, eastern Guangdong) that have historical links to maritime migration.
  • Widespread presence across Island Southeast Asia (Borneo, Sulawesi, eastern Indonesia) and detectable contributions in western and central Pacific populations through the Austronesian expansion.
  • Low-frequency occurrences in mainland Southeast Asia, coastal South Asia, and parts of Japan/Korea, often reflecting later admixture or small-scale gene flow.

Sampling bias (greater sampling in some islands and regions than others) affects precise frequency estimates; whole Y-chromosome sequencing and ancient DNA are clarifying the finer-scale geographic structure.

Historical and Cultural Significance

O1A1 is strongly associated with the Austronesian expansion, one of the major maritime dispersals of the Holocene. This genetic signature parallels archaeological, linguistic, and cultural evidence for seafaring, horticulture, and island colonization originating from Taiwan / the northern Philippines and spreading through Island Southeast Asia to Remote Oceania (Lapita and later Polynesian settlement).

Archaeological cultures and phases of interest include the early Neolithic Dapenkeng cultural complex in Taiwan (linked to early Austronesian communities), later Lapita-associated communities in Near Oceania and Remote Oceania, and a broad Neolithic/post-Neolithic coastal farming and seafaring milieu. The presence of O1A1 in these populations provides a paternal-line perspective on demographic processes such as founder effects, male-biased migration, and coastal-connected exchange networks.

Conclusion

Y-DNA haplogroup O1A1 is an informative paternal marker for studying southern East Asian coastal populations and the Austronesian maritime dispersal. Its phylogeography — high diversity in Taiwan and the northern Philippines with derived branches across Island Southeast Asia and into the Pacific — supports models of coastal origin followed by successive island colonizations. Ongoing high-resolution sequencing and ancient DNA sampling continue to refine subclade relationships, dates, and the detailed migratory routes associated with O1A1.

Research caveats: frequency and diversity estimates depend on sampling intensity and marker resolution. Precise SNP-defined subclade names and ages are updated frequently as new Y-chromosome data become available.

Key Points

  • Origins and Evolution
  • Subclades
  • Geographical Distribution
  • Historical and Cultural Significance
  • Conclusion
Chapter II

Tree & Relationships

Phylogenetic context and subclades

Evolution Path

This haplogroup's evolutionary journey from its earliest ancestor to the present.

Steps Haplogroup Age Estimate Archaeology Era Time Passed Immediate Descendants Tested Modern Descendants Ancient Connections
1 O1A1 Current ~9,000 years ago 🌾 Neolithic 9,000 years 1 0 0

Siblings (1)

Other branches from the same parent haplogroup

Chapter III

Where in the World

Geographic distribution and modern presence

Place of Origin

Southern China / Taiwan

Modern Distribution

The populations where Y-DNA haplogroup O1A1 is found include:

  1. Indigenous Taiwanese (Austronesian-speaking groups such as Amis, Atayal, Paiwan)
  2. Indigenous and lowland populations of the northern Philippines (e.g., Ivatan, some Tagalog and Visayan groups)
  3. Coastal southern Chinese populations (notably Fujianese and some Guangdong coastal groups)
  4. Island Southeast Asian populations (e.g., parts of Indonesia, Malaysia, Borneo, Sulawesi)
  5. Pacific islanders associated with Austronesian and Lapita-derived populations (including some Polynesian lineages)
  6. Mainland Southeast Asian groups at lower frequencies (Vietnamese, Thai) and rare occurrences in coastal South Asia and parts of Japan/Korea

Regional Presence

East Asia (southern China, Taiwan) High
Southeast Asia (Island Southeast Asia) High
Oceania (Pacific Islands) Moderate
Northeast Asia (Japan, Korea) Low
South Asia (coastal) Low
CHAPTER IV

When in Time

Your haplogroup in the context of human history

~10k years ago

Neolithic Revolution

Agriculture begins, settled communities form

~9k years ago

Haplogroup O1A1

Your Y-DNA haplogroup emerged in Southern China / Taiwan

Southern China / Taiwan
~5k years ago

Bronze Age

Metalworking, writing, and early civilizations

~3k years ago

Iron Age

Iron tools, expanded trade networks

~2k years ago

Classical Antiquity

Greek and Roman civilizations flourish

Present

Present Day

Modern era

Your Haplogroup
Historical Era
Chapter IV-B

Linked Cultures

Ancient cultures associated with Y-DNA haplogroup O1A1

Cultural Heritage

These ancient cultures have been linked to haplogroup O1A1 based on matching ancient DNA samples from archaeological excavations. The presence of this haplogroup in these cultures provides insights into the migrations and population movements of populations carrying this haplogroup.

Chinese Island Southeast Asian Culture
Culture assignments are based on archaeological context of ancient DNA samples and may represent regional associations during specific time periods.
Chapter V

Sample Catalog

Top 50 ancient DNA samples directly related to haplogroup O1A1 or parent clades

50 / 50 samples
Portrait Sample Country Era Date Culture Y-DNA Match
Portrait of ancient individual I3736 from Taiwan, dated 1 CE - 800 CE
I3736
Taiwan Iron Age Taiwan 1 CE - 800 CE Taiwanese Iron O1a1a1a1-CTS1711 Direct
Portrait of ancient individual I3614 from Taiwan, dated 1 CE - 800 CE
I3614
Taiwan Iron Age Taiwan 1 CE - 800 CE Taiwanese Iron O2a2b2-CTS1366 Direct
Portrait of ancient individual I3618 from Taiwan, dated 1 CE - 800 CE
I3618
Taiwan Iron Age Taiwan 1 CE - 800 CE Taiwanese Iron O2a2b2a2-F706 Direct
Portrait of ancient individual I3731 from Taiwan, dated 1 CE - 800 CE
I3731
Taiwan Iron Age Taiwan 1 CE - 800 CE Taiwanese Iron O1a1a1a1-CTS1711 Direct
Portrait of ancient individual I8076 from Taiwan, dated 1 CE - 800 CE
I8076
Taiwan Iron Age Taiwan 1 CE - 800 CE Taiwanese Iron O-M119 Direct
Portrait of ancient individual I8080 from Taiwan, dated 1 CE - 800 CE
I8080
Taiwan Iron Age Taiwan 1 CE - 800 CE Taiwanese Iron O1a1a1a-F518 Direct
Portrait of ancient individual I14933 from Taiwan, dated 1 CE - 800 CE
I14933
Taiwan Iron Age Taiwan 1 CE - 800 CE Taiwanese Iron O1a2-F1081 Direct
Portrait of ancient individual I14931 from Taiwan, dated 1 CE - 800 CE
I14931
Taiwan Iron Age Taiwan 1 CE - 800 CE Taiwanese Iron O2a2-P201 Direct
Portrait of ancient individual I14929 from Taiwan, dated 1 CE - 800 CE
I14929
Taiwan Iron Age Taiwan 1 CE - 800 CE Taiwanese Iron O2a2b-F130 Direct
Portrait of ancient individual I14934 from Taiwan, dated 1 CE - 800 CE
I14934
Taiwan Iron Age Taiwan 1 CE - 800 CE Taiwanese Iron O1a1a1a1-CTS10963 Direct
Chapter VI

Carrier Distribution Map

Geographic distribution of 100 ancient DNA samples carrying haplogroup O1A1

Time Period Filter
All Time Periods
Showing all samples
Each marker represents an ancient individual
Chapter VII

Temporal Distribution

Distribution of carriers across archaeological periods

Chapter VIII

Geographic Distribution

Distribution of carriers by country of origin

Chapter IX

Country × Era Distribution

Cross-tabulation of carrier countries and archaeological periods

Data

Data & Provenance

Source information and data quality

Last Updated 2026-02-16
Confidence Score 50/100
Coverage Low
Data Source

We use the latest phylotree for YDNA haplogroup classification and data.