Menu
Y-DNA Haplogroup • Paternal Lineage

O1B1A1A1B1A

Y-DNA Haplogroup O1B1A1A1B1A

~2,000 years ago
Southern China–Taiwan coastal margin
0 subclades
Scroll to explore
Chapter I

The Story

The journey of Y-DNA haplogroup O1B1A1A1B1A

Origins and Evolution

Haplogroup O1B1A1A1B1A is a downstream branch of O1B1A1A1B1, itself associated with mid- to late-Holocene expansions from the southern China–Taiwan coastal margin. As a subclade, O1B1A1A1B1A likely arose during the period of Austronesian dispersals that began in the Neolithic–Late Holocene and continued through the Bronze/Iron Age in maritime Southeast Asia (approximately 2,500 years ago by coalescent estimates for this sublineage). Its phylogenetic position within O1b places it among paternal lineages commonly linked to seafaring, coastal settlement, and the spread of Austronesian languages and material culture.

Genetically, this clade inherits the general demographic signature of O1b-derived lineages: a pattern of geographic concentration in island and coastal populations, relatively shallow coalescence times compared with deeper East Asian Y-haplogroups, and strong association with other markers of Austronesian-speaking groups in both modern and ancient datasets.

Subclades

As a relatively terminal subclade of O1B1A1A1B1, O1B1A1A1B1A shows local diversification across Insular Southeast Asia. Population-based sequencing and targeted SNP surveys have revealed population-specific sublineages in Taiwan, parts of the northern Philippines, and eastern Indonesian islands (e.g., Sulawesi and the Lesser Sundas). These localized subclades are consistent with a model of rapid maritime expansion followed by island-by-island founder effects and subsequent drift.

Because O1B1A1A1B1A is downstream and regionally restricted, it tends to show less deep internal structure than older pan-East-Asian Y lineages; however, higher-resolution sequencing in under-sampled regions continues to reveal additional internal branches.

Geographical Distribution

Modern occurrences of O1B1A1A1B1A are concentrated in:

  • Indigenous Taiwanese groups and some coastal Fujian communities, where it can reach moderate to high local frequencies.
  • Multiple Austronesian-speaking populations of the Philippines, often at moderate frequency in island groups with strong ancestral links to Taiwan.
  • Eastern Indonesian islands (Sulawesi, Maluku, and the Lesser Sundas), where the haplogroup appears in communities tied to historical Austronesian settlement.
  • Ryukyu and some southwestern Japanese island populations at low to moderate frequency, reflecting northward Austronesian-related contacts or gene flow.
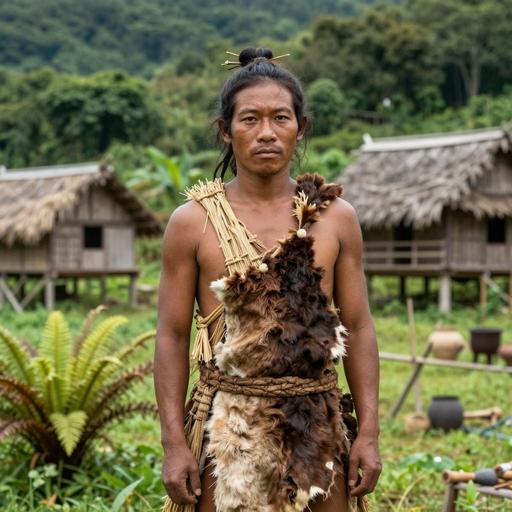
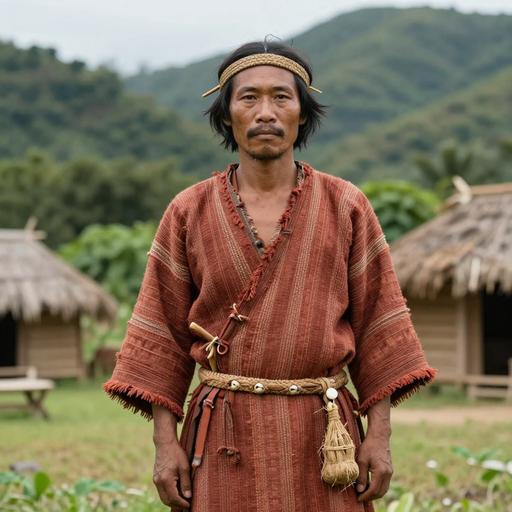
  • Coastal mainland Southeast Asian populations at low to moderate frequency in regions with maritime contact histories (e.g., coastal Vietnam, parts of coastal Thailand).
  • Low-frequency occurrences in parts of island Melanesia and occasional detections in coastal South Asian samples, generally interpreted as the result of later maritime contacts rather than primary settlement.

The distribution pattern mirrors archaeological and linguistic evidence for an origin on the Taiwan/southern China margin and subsequent island-hopping expansion into the Philippines and eastern Indonesia, with limited penetration into Remote Oceania.

Historical and Cultural Significance

O1B1A1A1B1A is best interpreted within the broader context of the Austronesian expansion. As a paternal lineage, it provides genetic corroboration of maritime-mediated dispersals that spread Austronesian languages, certain agricultural practices (e.g., root and tree crops), and distinctive material cultures across island Southeast Asia. In regions where this haplogroup is common, it often co-occurs with maternal haplogroups and autosomal components characteristic of Austronesian-speaking peoples (for example, mtDNA lineages such as B4a1a and specific Southeast Asian/Pacific autosomal signals).

In archaeological contexts, downstream O1b lineages (including O1B1A1A1B1A or close relatives) can complement findings from pottery traditions (e.g., early Neolithic coastal ceramics) and later Lapita-associated movements by indicating paternal continuity or input from Austronesian-derived coastal populations. However, the haplogroup is not a direct proxy for any single archaeological culture; rather, it is one genetic line of evidence that, together with archaeology and linguistics, clarifies patterns of migration and contact.

Conclusion

O1B1A1A1B1A represents a geographically focused, relatively recent paternal lineage tied to the coastal Taiwan/southern China region and the Austronesian maritime dispersal into Insular Southeast Asia. Its pattern—localized high frequencies in island populations, evidence of island-specific subclades, and low-frequency occurrences outside the core Austronesian zone—matches expectations from population genetics for a lineage that expanded by sea and then diversified in island contexts. Ongoing dense sampling and whole-Y sequencing across Southeast Asia and the Pacific will refine the internal structure and precise chronology of this clade.

Key Points

  • Origins and Evolution
  • Subclades
  • Geographical Distribution
  • Historical and Cultural Significance
  • Conclusion
Chapter II

Tree & Relationships

Phylogenetic context and subclades

Evolution Path

This haplogroup's evolutionary journey from its earliest ancestor to the present.

Steps Haplogroup Age Estimate Archaeology Era Time Passed Immediate Descendants Tested Modern Descendants Ancient Connections
1 O1B1A1A1B1A Current ~2,000 years ago 🏺 Classical Antiquity 2,500 years 0 5 0

Subclades (0)

Terminal branch - no known subclades

Chapter III

Where in the World

Geographic distribution and modern presence

Place of Origin

Southern China–Taiwan coastal margin

Modern Distribution

The populations where Y-DNA haplogroup O1B1A1A1B1A is found include:

  1. Indigenous Taiwanese and some Fujian coastal Han communities
  2. Multiple Austronesian-speaking groups in the Philippines
  3. Eastern Indonesian island populations (e.g., Sulawesi, Maluku, Lesser Sundas)
  4. Ryukyuan and some southwestern Japanese island populations
  5. Coastal mainland Southeast Asian communities (Vietnamese, Khmer, coastal Thai)
  6. Coastal communities across maritime Southeast Asia and low-frequency occurrences in parts of island Melanesia
  7. Occasional low-frequency occurrences in coastal South Asian samples reflecting historical maritime contact

Regional Presence

Southeast Asia (Maritime) High
East Asia (Taiwan, Ryukyu, Fujian coast) Moderate
Pacific Islands (Near Oceania / Melanesia) Low
South Asia (coastal occurrences) Low
CHAPTER IV

When in Time

Your haplogroup in the context of human history

~10k years ago

Neolithic Revolution

Agriculture begins, settled communities form

~5k years ago

Bronze Age

Metalworking, writing, and early civilizations

~3k years ago

Iron Age

Iron tools, expanded trade networks

~2k years ago

Classical Antiquity

Greek and Roman civilizations flourish

~2k years ago

Haplogroup O1B1A1A1B1A

Your Y-DNA haplogroup emerged in Southern China–Taiwan coastal margin

Southern China–Taiwan coastal margin
Present

Present Day

Modern era

Your Haplogroup
Historical Era
Chapter IV-B

Linked Cultures

Ancient cultures associated with Y-DNA haplogroup O1B1A1A1B1A

Cultural Heritage

These ancient cultures have been linked to haplogroup O1B1A1A1B1A based on matching ancient DNA samples from archaeological excavations. The presence of this haplogroup in these cultures provides insights into the migrations and population movements of populations carrying this haplogroup.

Cambodian Iron Age Indeterminate Laotian Island Southeast Asian Culture Laotian Bronze Age Yellow River Culture
Culture assignments are based on archaeological context of ancient DNA samples and may represent regional associations during specific time periods.
Chapter V

Sample Catalog

Top 50 ancient DNA samples directly related to haplogroup O1B1A1A1B1A or parent clades

50 / 50 samples
Portrait Sample Country Era Date Culture Y-DNA Match
Portrait of ancient individual I3736 from Taiwan, dated 1 CE - 800 CE
I3736
Taiwan Iron Age Taiwan 1 CE - 800 CE Taiwanese Iron O1a1a1a1-CTS1711 Direct
Portrait of ancient individual I3614 from Taiwan, dated 1 CE - 800 CE
I3614
Taiwan Iron Age Taiwan 1 CE - 800 CE Taiwanese Iron O2a2b2-CTS1366 Direct
Portrait of ancient individual I3618 from Taiwan, dated 1 CE - 800 CE
I3618
Taiwan Iron Age Taiwan 1 CE - 800 CE Taiwanese Iron O2a2b2a2-F706 Direct
Portrait of ancient individual I3731 from Taiwan, dated 1 CE - 800 CE
I3731
Taiwan Iron Age Taiwan 1 CE - 800 CE Taiwanese Iron O1a1a1a1-CTS1711 Direct
Portrait of ancient individual I8076 from Taiwan, dated 1 CE - 800 CE
I8076
Taiwan Iron Age Taiwan 1 CE - 800 CE Taiwanese Iron O-M119 Direct
Portrait of ancient individual I8080 from Taiwan, dated 1 CE - 800 CE
I8080
Taiwan Iron Age Taiwan 1 CE - 800 CE Taiwanese Iron O1a1a1a-F518 Direct
Portrait of ancient individual I14933 from Taiwan, dated 1 CE - 800 CE
I14933
Taiwan Iron Age Taiwan 1 CE - 800 CE Taiwanese Iron O1a2-F1081 Direct
Portrait of ancient individual I14931 from Taiwan, dated 1 CE - 800 CE
I14931
Taiwan Iron Age Taiwan 1 CE - 800 CE Taiwanese Iron O2a2-P201 Direct
Portrait of ancient individual I14929 from Taiwan, dated 1 CE - 800 CE
I14929
Taiwan Iron Age Taiwan 1 CE - 800 CE Taiwanese Iron O2a2b-F130 Direct
Portrait of ancient individual I14934 from Taiwan, dated 1 CE - 800 CE
I14934
Taiwan Iron Age Taiwan 1 CE - 800 CE Taiwanese Iron O1a1a1a1-CTS10963 Direct
Chapter VI

Carrier Distribution Map

Geographic distribution of 100 ancient DNA samples carrying haplogroup O1B1A1A1B1A

Time Period Filter
All Time Periods
Showing all samples
Each marker represents an ancient individual
Chapter VII

Temporal Distribution

Distribution of carriers across archaeological periods

Chapter VIII

Geographic Distribution

Distribution of carriers by country of origin

Chapter IX

Country × Era Distribution

Cross-tabulation of carrier countries and archaeological periods

Data

Data & Provenance

Source information and data quality

Last Updated 2026-02-16
Confidence Score 50/100
Coverage Low
Data Source

We use the latest phylotree for YDNA haplogroup classification and data.