Menu
Y-DNA Haplogroup • Paternal Lineage

O2A1B1A

Y-DNA Haplogroup O2A1B1A

~2,000 years ago
Mainland Southeast Asia / Southern China
1 subclades
Scroll to explore
Chapter I

The Story

The journey of Y-DNA haplogroup O2A1B1A

Origins and Evolution

Haplogroup O2A1B1A is a subclade within the broader O2a (O-M95) radiation, which is deeply associated with Holocene demographic processes in Mainland Southeast Asia and southern China. Given its phylogenetic position downstream of O2A1B1, O2A1B1A most plausibly originated after the initial O-M95 expansions that are linked to Neolithic and post‑Neolithic movements of rice- and millet-farming populations. The estimated time depth for O2A1B1A (on the order of a few thousand years) places its origin in the mid-to-late Holocene, consistent with local differentiation following agricultural dispersals and regionally localized demographic processes.

Subclades

As a downstream lineage, O2A1B1A may itself contain further internal substructure detectable with high-resolution SNP testing or comprehensive sequencing. Published population-level surveys that genotype only a limited set of markers often group several closely related branches together; full phylogenetic resolution requires targeted SNP discovery or full Y-chromosome sequencing. Subclades of O2A1B1A are expected to show geographically structured patterns reflecting local founder events, linguistic associations, and recent historical migrations within Mainland Southeast Asia and adjacent areas.

Geographical Distribution

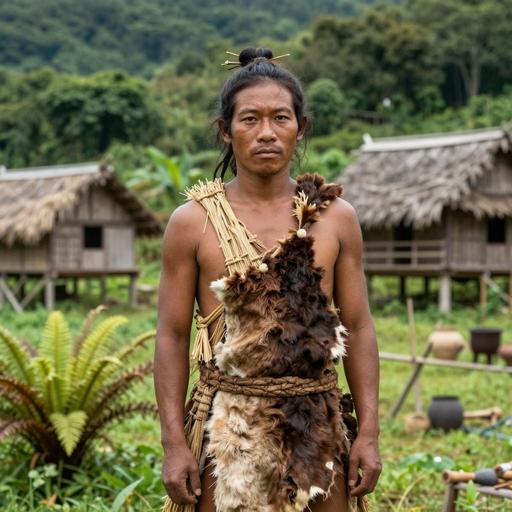
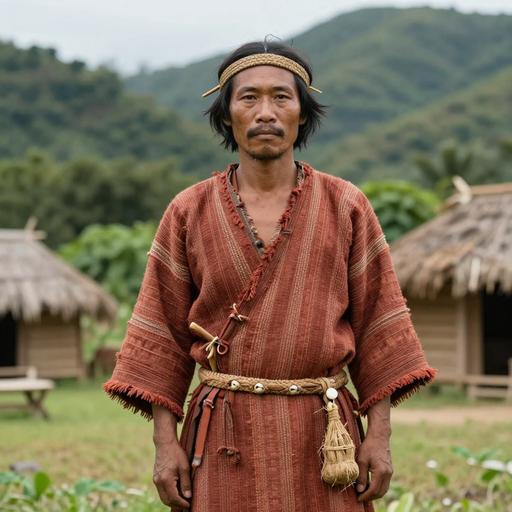
The highest frequencies and the greatest diversity of O2A1B1A are expected in Mainland Southeast Asia (particularly among Austroasiatic-speaking groups and neighbors) and in adjacent southern Chinese populations. Secondary, lower-frequency occurrences are found in parts of South Asia (notably among some Munda-speaking groups in eastern and central India), in portions of Island Southeast Asia and indigenous Taiwanese populations (likely via historical admixture and Austronesian interactions), and sporadically in southern Han Chinese groups. The distribution pattern is consistent with an origin in Mainland Southeast Asia/southern China followed by localized spread and occasional long-distance gene flow.

Historical and Cultural Significance

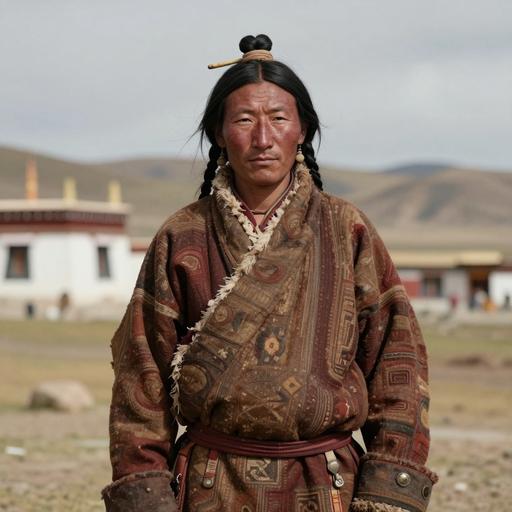
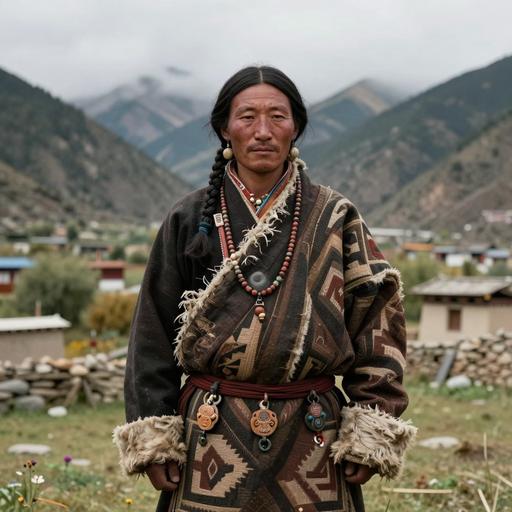
Because O2A1B1A descends from lineages tied to O-M95, it likely participated in the demographic processes associated with the spread of wet-rice agriculture and related cultural complexes across Mainland Southeast Asia during the Neolithic and later Holocene. In many populations where it occurs at appreciable frequency, O2A1B1A will co-occur with other Y-chromosome lineages typical of the region, reflecting both ancient language-linked expansions (e.g., Austroasiatic) and subsequent contacts with Tai-Kadai, Hmong-Mien, and Sino-Tibetan groups. Low-frequency occurrences in South Asia (Munda groups) reflect the documented east-to-west movement of some Austroasiatic-speaking paternal lineages into India.

Conclusion

O2A1B1A represents a regionally important derivative of the O-M95/O2a complex, whose mid-Holocene origin and present-day geographic pattern mirror agriculture-associated expansions and later population structuring in Mainland Southeast Asia and adjacent areas. High-resolution genotyping and ancient DNA sampling in targeted regions will refine its internal branching, time estimates, and precise archaeological correlates, but current population-genetic evidence supports a Southeast Asian origin with pockets of secondary dispersal into neighboring regions.

Key Points

  • Origins and Evolution
  • Subclades
  • Geographical Distribution
  • Historical and Cultural Significance
  • Conclusion
Chapter II

Tree & Relationships

Phylogenetic context and subclades

Evolution Path

This haplogroup's evolutionary journey from its earliest ancestor to the present.

Steps Haplogroup Age Estimate Archaeology Era Time Passed Immediate Descendants Tested Modern Descendants Ancient Connections
1 O2A1B1A Current ~2,000 years ago 🏺 Classical Antiquity 2,500 years 1 0 0
Chapter III

Where in the World

Geographic distribution and modern presence

Place of Origin

Mainland Southeast Asia / Southern China

Modern Distribution

The populations where Y-DNA haplogroup O2A1B1A is found include:

  1. Austroasiatic-speaking populations of mainland Southeast Asia (e.g., Khmer, Mon, Vietic subgroups)
  2. Mainland Southeast Asian populations (e.g., Thai, Lao, Shan and related groups)
  3. Southern Han Chinese and ethnic minorities in southern China (e.g., Guangxi, Yunnan)
  4. Munda-speaking groups in eastern and central India (low frequencies)
  5. Austronesian-speaking groups in Island Southeast Asia (variable, generally lower frequencies)
  6. Indigenous Taiwanese populations (sporadic occurrences)
  7. Burmese and other mainland Southeast Asian hill populations (sporadic/low)
  8. Sporadic occurrences in Japan and other East Asian populations due to later gene flow

Regional Presence

Southeast Asia High
East Asia (southern China) Moderate
South Asia (eastern/central India) Low
Island Southeast Asia / Near Oceania Low
CHAPTER IV

When in Time

Your haplogroup in the context of human history

~10k years ago

Neolithic Revolution

Agriculture begins, settled communities form

~5k years ago

Bronze Age

Metalworking, writing, and early civilizations

~3k years ago

Iron Age

Iron tools, expanded trade networks

~2k years ago

Classical Antiquity

Greek and Roman civilizations flourish

~2k years ago

Haplogroup O2A1B1A

Your Y-DNA haplogroup emerged in Mainland Southeast Asia / Southern China

Mainland Southeast Asia / Southern China
Present

Present Day

Modern era

Your Haplogroup
Historical Era
Chapter IV-B

Linked Cultures

Ancient cultures associated with Y-DNA haplogroup O2A1B1A

Cultural Heritage

These ancient cultures have been linked to haplogroup O2A1B1A based on matching ancient DNA samples from archaeological excavations. The presence of this haplogroup in these cultures provides insights into the migrations and population movements of populations carrying this haplogroup.

Chinese West Liao River Culture
Culture assignments are based on archaeological context of ancient DNA samples and may represent regional associations during specific time periods.
Chapter V

Sample Catalog

Top 50 ancient DNA samples directly related to haplogroup O2A1B1A or parent clades

50 / 50 samples
Portrait Sample Country Era Date Culture Y-DNA Match
Portrait of ancient individual I3736 from Taiwan, dated 1 CE - 800 CE
I3736
Taiwan Iron Age Taiwan 1 CE - 800 CE Taiwanese Iron O1a1a1a1-CTS1711 Direct
Portrait of ancient individual I3614 from Taiwan, dated 1 CE - 800 CE
I3614
Taiwan Iron Age Taiwan 1 CE - 800 CE Taiwanese Iron O2a2b2-CTS1366 Direct
Portrait of ancient individual I3618 from Taiwan, dated 1 CE - 800 CE
I3618
Taiwan Iron Age Taiwan 1 CE - 800 CE Taiwanese Iron O2a2b2a2-F706 Direct
Portrait of ancient individual I3731 from Taiwan, dated 1 CE - 800 CE
I3731
Taiwan Iron Age Taiwan 1 CE - 800 CE Taiwanese Iron O1a1a1a1-CTS1711 Direct
Portrait of ancient individual I8076 from Taiwan, dated 1 CE - 800 CE
I8076
Taiwan Iron Age Taiwan 1 CE - 800 CE Taiwanese Iron O-M119 Direct
Portrait of ancient individual I8080 from Taiwan, dated 1 CE - 800 CE
I8080
Taiwan Iron Age Taiwan 1 CE - 800 CE Taiwanese Iron O1a1a1a-F518 Direct
Portrait of ancient individual I14933 from Taiwan, dated 1 CE - 800 CE
I14933
Taiwan Iron Age Taiwan 1 CE - 800 CE Taiwanese Iron O1a2-F1081 Direct
Portrait of ancient individual I14931 from Taiwan, dated 1 CE - 800 CE
I14931
Taiwan Iron Age Taiwan 1 CE - 800 CE Taiwanese Iron O2a2-P201 Direct
Portrait of ancient individual I14929 from Taiwan, dated 1 CE - 800 CE
I14929
Taiwan Iron Age Taiwan 1 CE - 800 CE Taiwanese Iron O2a2b-F130 Direct
Portrait of ancient individual I14934 from Taiwan, dated 1 CE - 800 CE
I14934
Taiwan Iron Age Taiwan 1 CE - 800 CE Taiwanese Iron O1a1a1a1-CTS10963 Direct
Chapter VI

Carrier Distribution Map

Geographic distribution of 100 ancient DNA samples carrying haplogroup O2A1B1A

Time Period Filter
All Time Periods
Showing all samples
Each marker represents an ancient individual
Chapter VII

Temporal Distribution

Distribution of carriers across archaeological periods

Chapter VIII

Geographic Distribution

Distribution of carriers by country of origin

Chapter IX

Country × Era Distribution

Cross-tabulation of carrier countries and archaeological periods

Data

Data & Provenance

Source information and data quality

Last Updated 2026-02-16
Confidence Score 50/100
Coverage Low
Data Source

We use the latest phylotree for YDNA haplogroup classification and data.