Menu
Y-DNA Haplogroup • Paternal Lineage

N1A2

Y-DNA Haplogroup N1A2

~8,000 years ago
Northeast Eurasia / Siberia
2 subclades
Scroll to explore
Chapter I

The Story

The journey of Y-DNA haplogroup N1A2

Origins and Evolution

Haplogroup N1A2 is a subclade of N1A, itself a major branch of haplogroup N that formed in Northeast/East Asia in the Late Pleistocene. N1A2 likely emerged in northeastern Eurasia during the early to mid‑Holocene as populations that carried N1A diversified while expanding into northern latitudes after the Last Glacial Maximum. Its divergence time is younger than the N1A parental node (estimated ~17 kya) and fits a scenario of Holocene regional differentiation and north‑westward spread into Fennoscandia and parts of north‑central Eurasia.

Subclades

Within N1A2 there are downstream lineages defined by downstream SNPs (different research groups use varying names), and those subclades show regional substructure correlating with geography and language in some cases. Some subbranches are relatively common in Fennoscandian and Baltic populations, while others are more frequent among Tungusic and other Siberian groups. Ongoing high‑resolution sequencing continues to resolve additional subclades and their geographic signatures.

Geographical Distribution

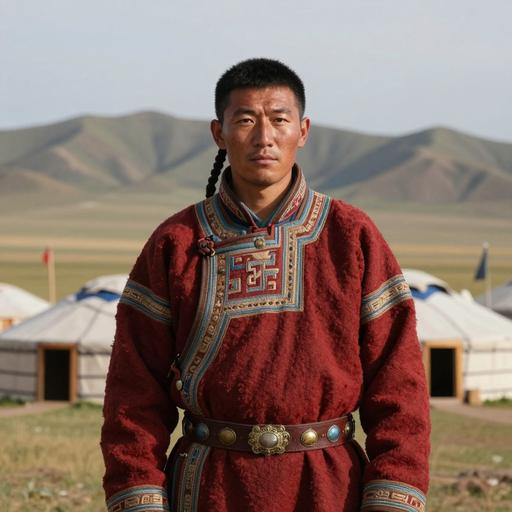
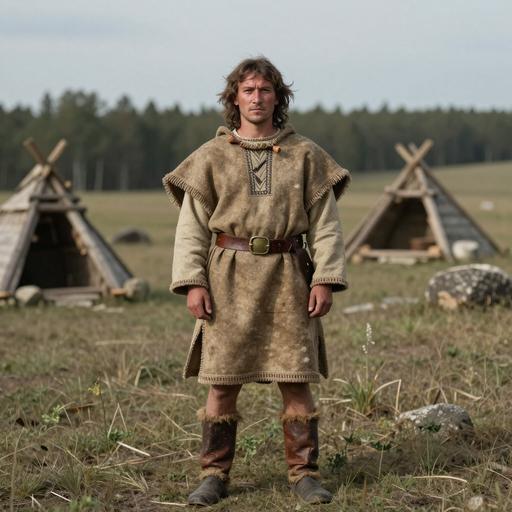
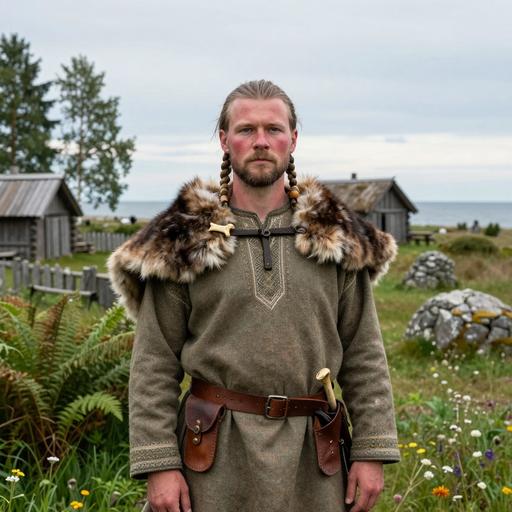
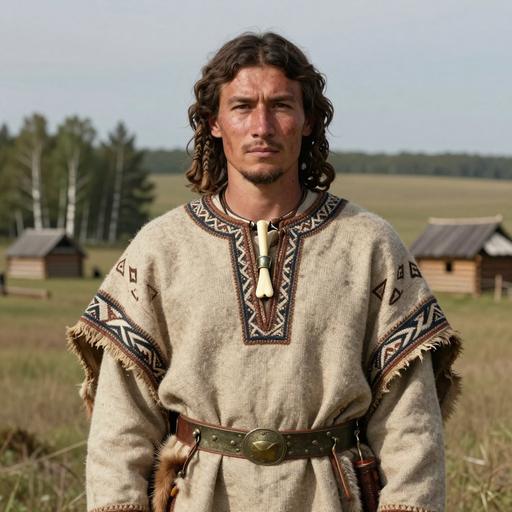
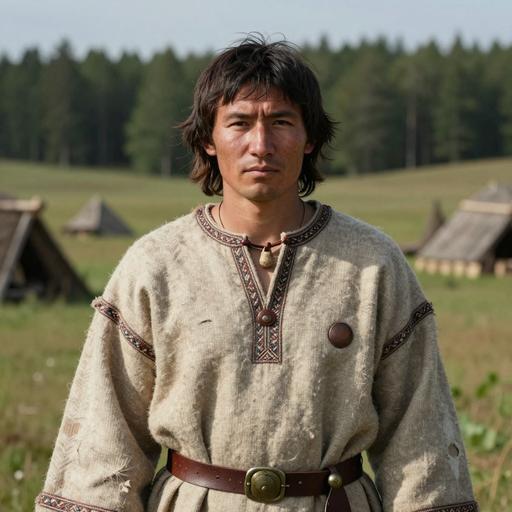
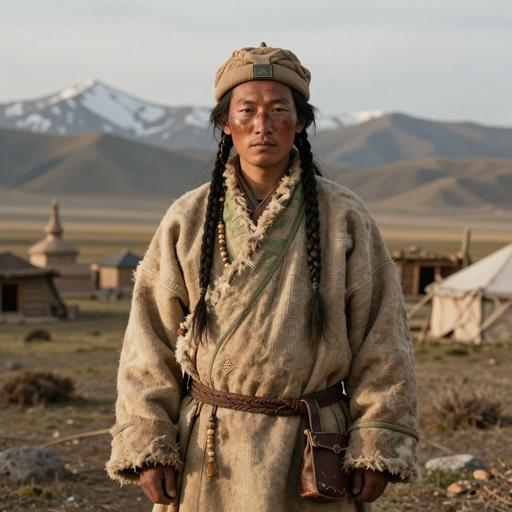
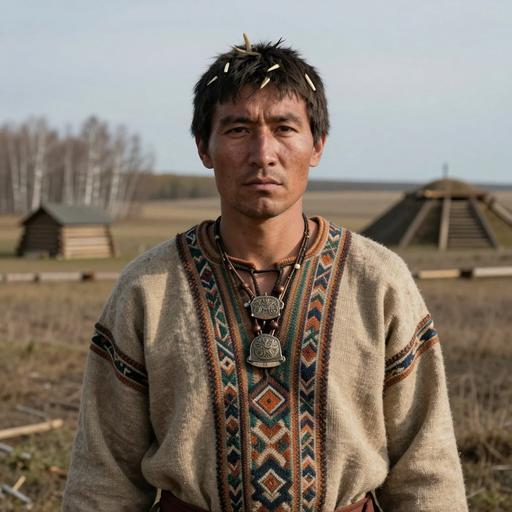
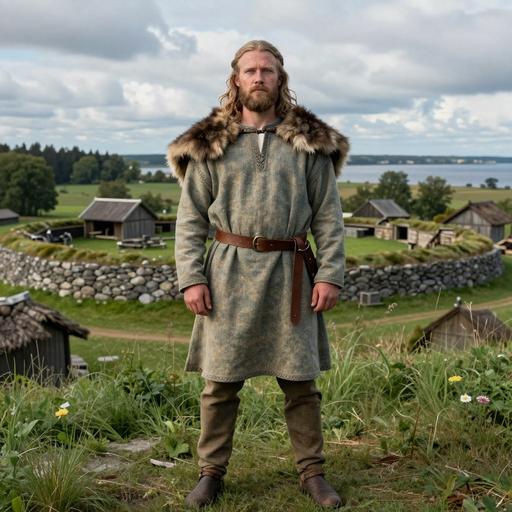
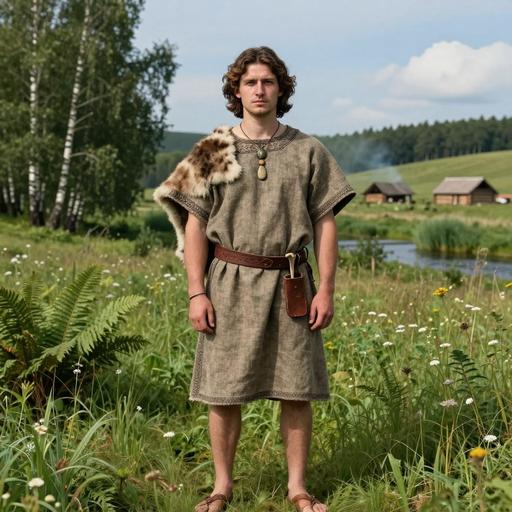
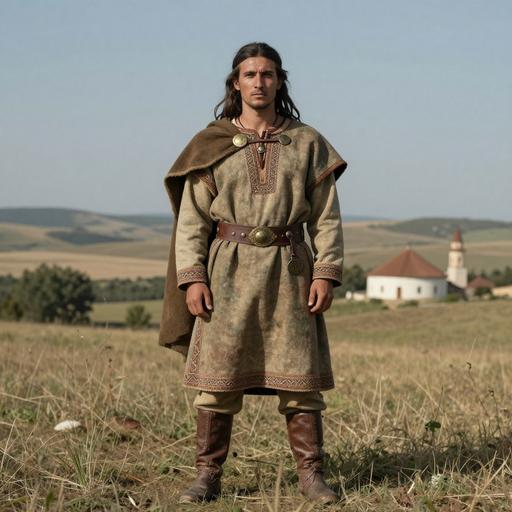
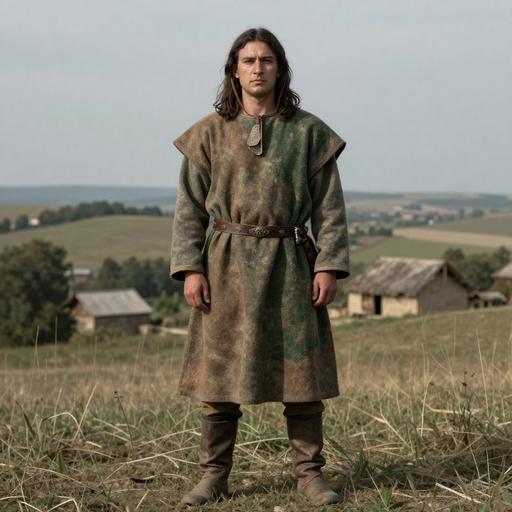
N1A2 has a northerly distribution across Eurasia with highest frequencies in parts of northern Europe (notably among some Finnish, Estonian and Sámi groups) and measurable presence across northwestern and central Siberia. It also occurs at lower frequencies in northern Russian populations, certain Uralic‑speaking groups (Komi, Nenets, Mansi, Khanty), and sporadically in neighboring populations of northeastern Asia. The haplogroup's distribution reflects a mix of deep post‑glacial recolonization patterns and later Holocene demographic processes (language spread, local founder effects).

Historical and Cultural Significance

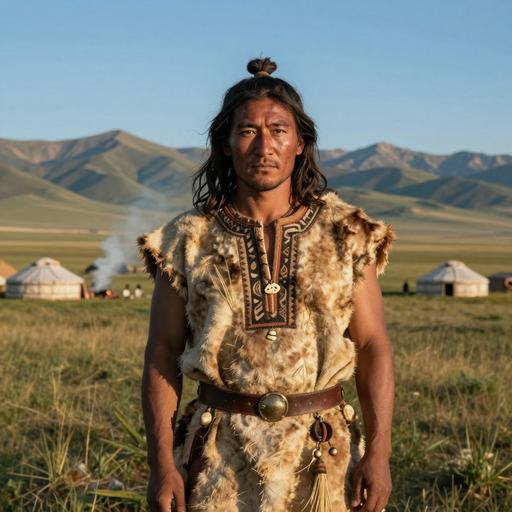
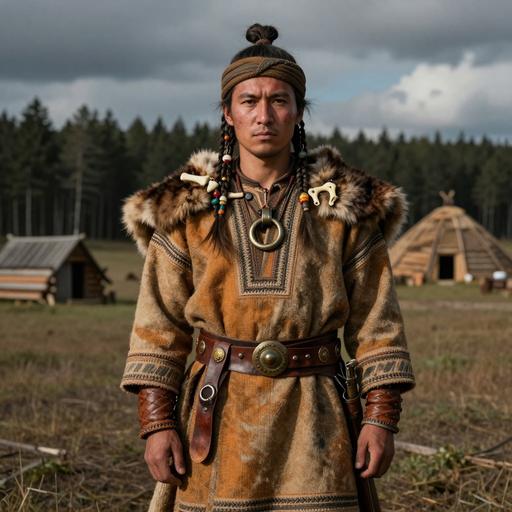
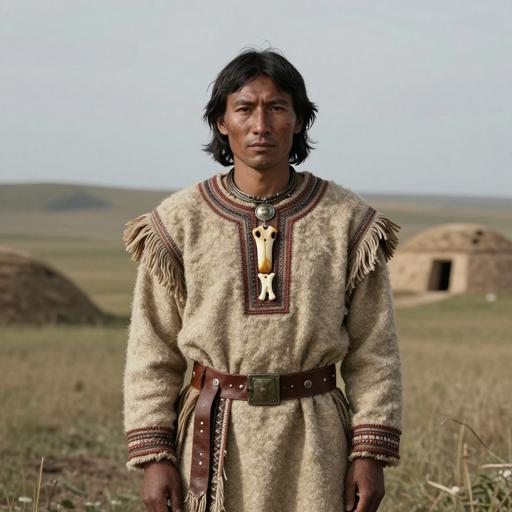
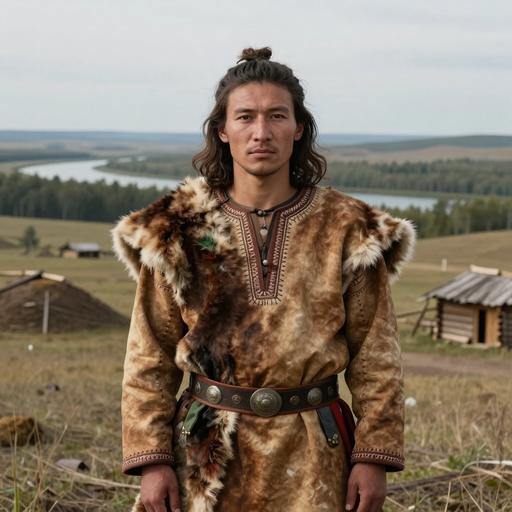
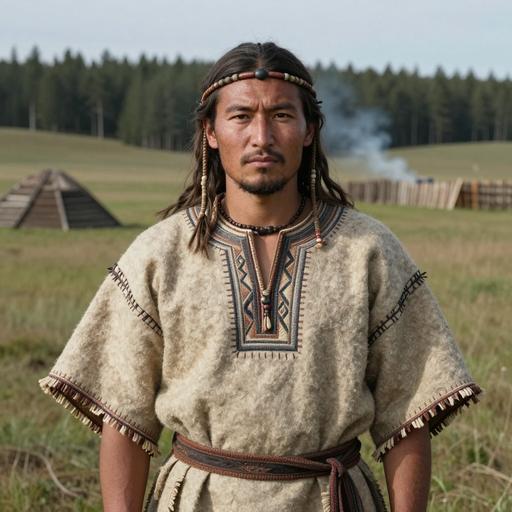
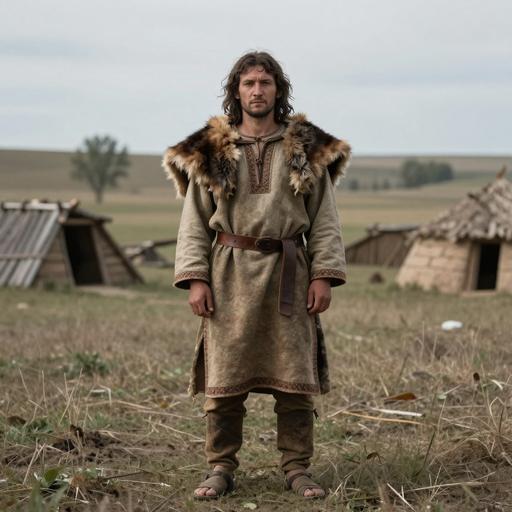
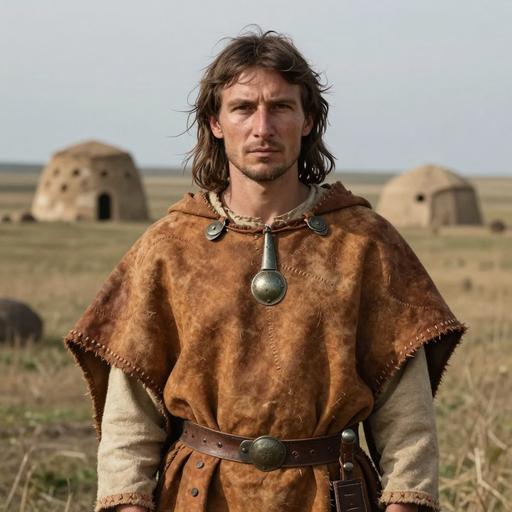
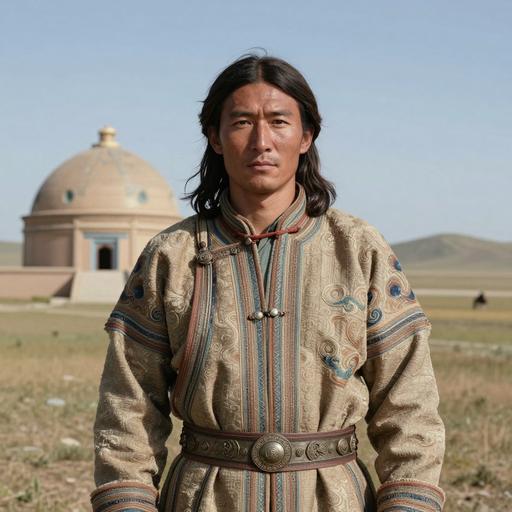
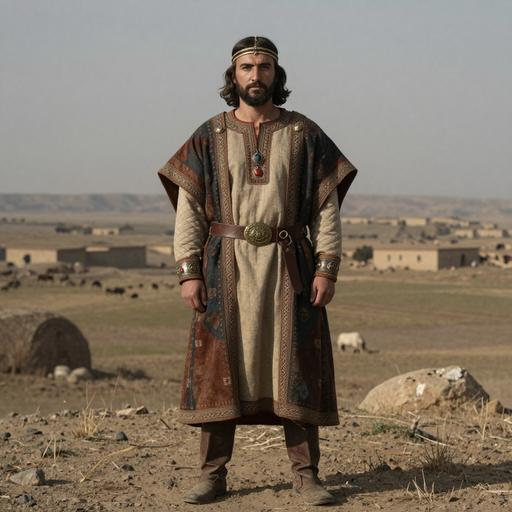
Genetic studies associate lineages derived from haplogroup N (including N1A2) with the paternal heritage of many Uralic‑speaking populations and other northern Eurasian groups. This association is consistent with genetic continuity in high‑latitude regions and with archaeological evidence for hunter‑gatherer and early pastoralist occupations of northern Eurasia. N1A2 is not typically associated with the early Anatolian farmer expansions that shaped much of southern and central Europe; rather its history is tied to northern post‑glacial and Holocene population movements, local expansions during the Bronze and Iron Ages, and the later ethnolinguistic processes that produced present‑day Uralic and several Siberian populations.

Ancient DNA evidence for N1A2 is limited but present (the database referenced contains three ancient samples). Those occurrences suggest the lineage was present in the archaeological record of northern Eurasia during the Holocene, consistent with a demographic history involving persistence and regional expansions rather than one single continent‑wide replacement.

Conclusion

N1A2 is a northern Eurasian Y‑chromosome lineage derived from N1A that illustrates the complex interplay of post‑glacial recolonization, Holocene regional differentiation, and later cultural‑linguistic processes in shaping the paternal gene pool of Fennoscandia and parts of Siberia. Continued sampling and whole‑Y sequencing are refining its internal structure and clarifying the timing and routes of its expansions.

Key Points

  • Origins and Evolution
  • Subclades
  • Geographical Distribution
  • Historical and Cultural Significance
  • Conclusion
Chapter II

Tree & Relationships

Phylogenetic context and subclades

Evolution Path

This haplogroup's evolutionary journey from its earliest ancestor to the present.

Steps Haplogroup Age Estimate Archaeology Era Time Passed Immediate Descendants Tested Modern Descendants Ancient Connections
1 N1A2 Current ~8,000 years ago 🌾 Neolithic 8,000 years 2 1 0

Siblings (1)

Other branches from the same parent haplogroup

Chapter III

Where in the World

Geographic distribution and modern presence

Place of Origin

Northeast Eurasia / Siberia

Modern Distribution

The populations where Y-DNA haplogroup N1A2 is found include:

  1. Finns and other Northern European populations (e.g., Estonians, some Latvians)
  2. Sámi and other Fennoscandian groups
  3. Northwestern and central Siberian indigenous groups (e.g., Nenets, Komi‑Zyryan, some Evenk subgroups)
  4. Northern Russians and populations of the Russian Arctic fringe
  5. Uralic‑speaking groups (e.g., Komi, Mansi, Khanty; low frequencies in Hungarians)
  6. Some Northeast Asian populations at low frequencies (northern Mongolian and northern Han groups)

Regional Presence

Northern Europe High
Eastern Europe Moderate
Siberia Moderate
Northeast Asia Low
Central Asia Low
CHAPTER IV

When in Time

Your haplogroup in the context of human history

~10k years ago

Neolithic Revolution

Agriculture begins, settled communities form

~8k years ago

Haplogroup N1A2

Your Y-DNA haplogroup emerged in Northeast Eurasia / Siberia

Northeast Eurasia / Siberia
~5k years ago

Bronze Age

Metalworking, writing, and early civilizations

~3k years ago

Iron Age

Iron tools, expanded trade networks

~2k years ago

Classical Antiquity

Greek and Roman civilizations flourish

Present

Present Day

Modern era

Your Haplogroup
Historical Era
Chapter IV-B

Linked Cultures

Ancient cultures associated with Y-DNA haplogroup N1A2

Cultural Heritage

These ancient cultures have been linked to haplogroup N1A2 based on matching ancient DNA samples from archaeological excavations. The presence of this haplogroup in these cultures provides insights into the migrations and population movements of populations carrying this haplogroup.

Avar Culture Coastal Neolithic Early Medieval Mongolian Gorokhov Khovd Long-Term Lena River Culture Mongun-Taiga Culture Sargat Culture Shekshovo Culture Transbaikal Culture Xiongnu Tuv Yankovsky Culture
Culture assignments are based on archaeological context of ancient DNA samples and may represent regional associations during specific time periods.
Chapter V

Sample Catalog

Top 50 ancient DNA samples directly related to haplogroup N1A2 or parent clades

50 / 50 samples
Portrait Sample Country Era Date Culture Y-DNA Match
Portrait of ancient individual I15156 from Taiwan, dated 1 CE - 800 CE
I15156
Taiwan Iron Age Taiwan 1 CE - 800 CE Taiwanese Iron NO-M214 Direct
Portrait of ancient individual KHO007 from Mongolia, dated 26 CE - 125 CE
KHO007
Mongolia Middle to Late Bronze Age to Xiongnu to Late Medieval Khovd, Mongolia 26 CE - 125 CE Khovd Long-Term N-Tat Direct
Portrait of ancient individual DA171 from Lithuania, dated 50 CE - 650 CE
DA171
Lithuania Late Antiquity Lithuania 50 CE - 650 CE Lithuanian Late Antiquity N-L1025 Direct
Portrait of ancient individual DA171 from Lithuania, dated 50 CE - 650 CE
DA171
Lithuania Late Iron Age Baltic Region 50 CE - 650 CE N-L1025 Direct
Portrait of ancient individual YUR001 from Mongolia, dated 52 BCE - 62 CE
YUR001
Mongolia Xiongnu Period Selenge, Mongolia 52 BCE - 62 CE Xiongnu Culture N-Y125475 Direct
Portrait of ancient individual IMA005 from Russia, dated 169 BCE - 44 BCE
IMA005
Russia Xiongnu Period Buryatia, Russia 169 BCE - 44 BCE Xiongnu Buryat N-P89 Direct
Portrait of ancient individual SON001 from Mongolia, dated 200 BCE - 100 CE
SON001
Mongolia Xiongnu Period Tuv, Mongolia 200 BCE - 100 CE Xiongnu Tuv N-CTS6380 Direct
Portrait of ancient individual BGD004 from Russia, dated 200 BCE - 1 BCE
BGD004
Russia Iron Age Sargat Culture, Russia 200 BCE - 1 BCE Sargat Culture N-L839 Direct
Portrait of ancient individual VK579 from Sweden, dated 200 CE - 400 CE
VK579
Sweden Iron Age Sweden 200 CE - 400 CE Nordic Iron Age N1a1a1a1a Direct
Portrait of ancient individual VK579 from Sweden, dated 200 CE - 400 CE
VK579
Sweden Iron Age Nordic Region 200 CE - 400 CE N-L550 Direct
Chapter VI

Carrier Distribution Map

Geographic distribution of 100 ancient DNA samples carrying haplogroup N1A2

Time Period Filter
All Time Periods
Showing all samples
Each marker represents an ancient individual
Chapter VII

Temporal Distribution

Distribution of carriers across archaeological periods

Chapter VIII

Geographic Distribution

Distribution of carriers by country of origin

Chapter IX

Country × Era Distribution

Cross-tabulation of carrier countries and archaeological periods

Data

Data & Provenance

Source information and data quality

Last Updated 2026-02-16
Confidence Score 50/100
Coverage Low
Data Source

We use the latest phylotree for YDNA haplogroup classification and data.