Menu
mtDNA Haplogroup • Maternal Lineage

H1AH2

mtDNA Haplogroup H1AH2

~9,000 years ago
Iberian Peninsula (Atlantic Europe)
0 subclades
Scroll to explore
Chapter I

The Story

The journey of mtDNA haplogroup H1AH2

Origins and Evolution

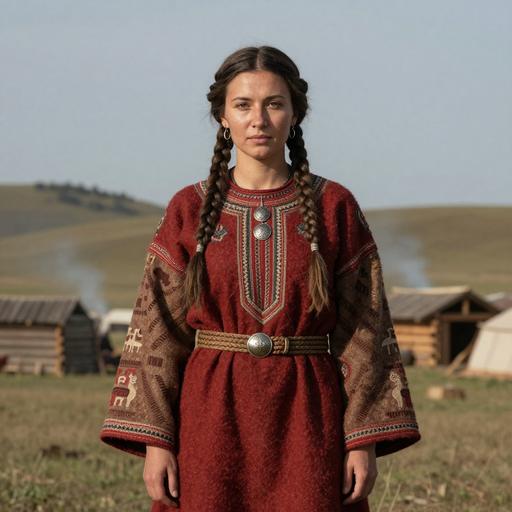
H1AH2 is a downstream subclade of the H1A/H1AH branch of mitochondrial haplogroup H1, a lineage broadly associated with post‑glacial re‑expansion from southwestern European refugia. Based on its phylogenetic position under H1AH and on geographic patterns seen in related H1 sublineages, H1AH2 most likely arose in the Iberian/Atlantic refuge region during the early Holocene (roughly ~9 kya, allowing for uncertainty in coalescence estimates). Its origin is consistent with a maternal lineage that participated in the Late Glacial to post‑glacial recolonization of western Europe and subsequent local differentiation along the Atlantic façade.

Mitochondrial subclades within H1 often show restricted regional clustering reflecting localized demographic expansions, drift, and founder effects; H1AH2 fits this general pattern as a relatively rare, regionally concentrated descendant of an Iberian‑centered H1A radiation.

Subclades

As a minor subclade, H1AH2 currently has limited documented internal branching in published surveys and ancient DNA datasets. Where present, H1AH2 may show small, geographically restricted substructure reflecting later coastal or island founder events (for example on Mediterranean islands or along Atlantic littoral communities). The limited number of confirmed sequences and low frequency mean that finer subclade resolution is still emerging and will benefit from additional complete mtDNA sequencing and aDNA sampling.

Geographical Distribution

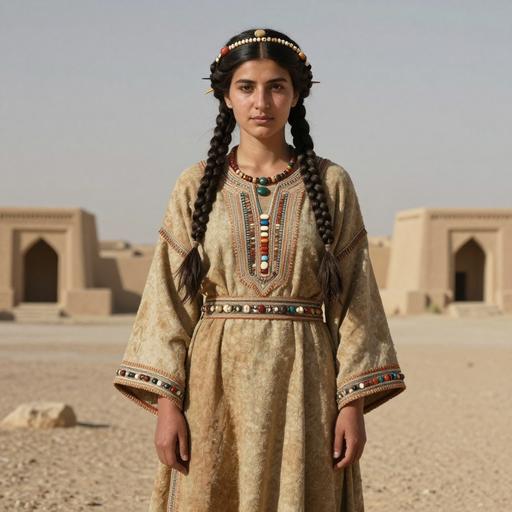
H1AH2 is highest in relative frequency in the Iberian Peninsula, notably among populations in north‑west Iberia and areas with strong persistence of post‑glacial maternal lineages (including parts of northern Spain and Portugal). It is observed at lower but detectable frequencies across parts of Western Europe (France, Britain, Ireland), in northwest Africa (Maghrebi and some Berber groups), and sporadically in southern European and Mediterranean island populations (Italy, Sardinia, Sicily, Corsica, Malta). Very low frequencies appear in northern European samples (Scandinavia) and scattered central/eastern European and Near Eastern samples, consistent with later mobility and admixture.

The pattern—concentration in Iberia with rare occurrences along the Atlantic coast, Mediterranean islands, and northwest Africa—matches expectations for a lineage tied to post‑glacial coastal recolonization and later maritime contacts across the western Mediterranean and Atlantic seaboard.

Historical and Cultural Significance

Although H1AH2 is not a high‑frequency hallmark of a single archaeological culture, its regional profile links it to several broad demographic processes:

  • Post‑glacial Mesolithic/early Holocene: Origin and local continuity in Iberia following the Last Glacial Maximum, contributing to Mesolithic maternal diversity in Atlantic Europe.
  • Neolithic and later farmer expansions: Interaction with incoming Neolithic farmers likely reduced but did not eliminate H1-derived lineages; H1AH2 likely persisted in local hunter‑gatherer and mixed farmer communities.
  • Bronze Age and maritime networks (including Bell Beaker and Atlantic Bronze Age dynamics): Low‑level movement along coastal trade and migration routes could have redistributed H1AH2 to other parts of Western Europe and to northwest Africa, explaining its scattered modern distribution.

A small number of ancient DNA identifications (including at least one confirmed archaeological sample in some databases) supports the antiquity of the lineage in western Europe, but broader aDNA coverage is needed to clarify its temporal dynamics through the Neolithic and Bronze Age.

Conclusion

H1AH2 is a geographically rooted, low‑frequency maternal lineage that exemplifies the localized differentiation of mtDNA haplogroup H1 after the Last Glacial Maximum. It likely originated in Iberia in the early Holocene and persisted through Mesolithic continuity, Neolithic admixture, and later coastal mobility, leaving a faint but traceable signal across the Atlantic façade, parts of the Mediterranean, and northwest Africa. Future dense sampling and ancient DNA will refine its chronology, internal structure, and the historical migrations that shaped its present distribution.

Key Points

  • Origins and Evolution
  • Subclades
  • Geographical Distribution
  • Historical and Cultural Significance
  • Conclusion
Chapter II

Tree & Relationships

Phylogenetic context and subclades

Evolution Path

This haplogroup's evolutionary journey from its earliest ancestor to the present.

Steps Haplogroup Age Estimate Archaeology Era Time Passed Immediate Descendants Tested Modern Descendants Ancient Connections
1 H1AH2 Current ~9,000 years ago 🌾 Neolithic 9,000 years 0 1 0
2 H1AH ~11,000 years ago 🌾 Neolithic 11,000 years 1 1 5
3 H1A ~13,000 years ago 🏹 Mesolithic 13,000 years 25 338 62
4 H1 ~15,000 years ago 🏹 Mesolithic 15,000 years 28 2,656 74
5 H ~25,000 years ago 🦴 Paleolithic 25,000 years 9 6,551 991
6 HV ~30,000 years ago 🦴 Paleolithic 30,000 years 10 7,905 228
7 R ~60,000 years ago 🦴 Paleolithic 60,000 years 12 10,987 57
8 N ~60,000 years ago 🦴 Paleolithic 60,000 years 15 15,452 13
9 L3 ~70,000 years ago 🦴 Paleolithic 70,000 years 11 17,621 6
10 L ~160,000 years ago 🦴 Paleolithic 160,000 years 7 18,987 5

Subclades (0)

Terminal branch - no known subclades

Chapter III

Where in the World

Geographic distribution and modern presence

Place of Origin

Iberian Peninsula (Atlantic Europe)

Modern Distribution

The populations where MTDNA haplogroup H1AH2 is found include:

  1. Iberian populations (Spain, Portugal, including Basques)
  2. Western European populations (France, Britain, Ireland)
  3. Southern European populations (Italy, Sardinia, Sicily)
  4. Northwest African populations (Morocco, Algeria; Berber groups)
  5. Scandinavian populations (Norway, Sweden, Denmark) at low frequencies
  6. Central and Eastern European populations at lower frequencies (e.g., Germany, Poland)
  7. Near Eastern populations (Anatolia, Levant) at very low frequencies
  8. Sporadic presence in Mediterranean island and diasporic communities (e.g., Malta, Corsica)
CHAPTER IV

When in Time

Your haplogroup in the context of human history

~10k years ago

Neolithic Revolution

Agriculture begins, settled communities form

~9k years ago

Haplogroup H1AH2

Your mtDNA haplogroup emerged in Iberian Peninsula (Atlantic Europe)

Iberian Peninsula (Atlantic Europe)
~5k years ago

Bronze Age

Metalworking, writing, and early civilizations

~3k years ago

Iron Age

Iron tools, expanded trade networks

~2k years ago

Classical Antiquity

Greek and Roman civilizations flourish

Present

Present Day

Modern era

Your Haplogroup
Historical Era
Chapter IV-B

Linked Cultures

Ancient cultures associated with mtDNA haplogroup H1AH2

Cultural Heritage

These ancient cultures have been linked to haplogroup H1AH2 based on matching ancient DNA samples from archaeological excavations. The presence of this haplogroup in these cultures provides insights into the migrations and population movements of populations carrying this haplogroup.

Albanian Iron Age Bell Beaker British Early Bronze Age Danish Medieval Iberian Middle Bronze Late Viking Los Millares Magyar Commoner Culture Occitanie Bronze Age Roopkund B Group Santok Culture Scottish Bronze Age Viking
Culture assignments are based on archaeological context of ancient DNA samples and may represent regional associations during specific time periods.
Chapter V

Sample Catalog

Top 50 ancient DNA samples directly related to haplogroup H1AH2 or parent clades

50 / 50 samples
Portrait Sample Country Era Date Culture mtDNA Match
Portrait of ancient individual R111 from Italy, dated 1 CE - 200 CE
R111
Italy Imperial Rome 1 CE - 200 CE Roman Empire H Direct
Portrait of ancient individual R113 from Italy, dated 1 CE - 200 CE
R113
Italy Imperial Rome 1 CE - 200 CE Roman Empire H26a1 Direct
Portrait of ancient individual R128 from Italy, dated 1 CE - 400 CE
R128
Italy Imperial Rome 1 CE - 400 CE Roman Empire HV-b Direct
Portrait of ancient individual R1543 from Italy, dated 1 CE - 400 CE
R1543
Italy Imperial Rome 1 CE - 400 CE Roman Empire H1e Direct
Portrait of ancient individual R1545 from Italy, dated 1 CE - 400 CE
R1545
Italy Imperial Rome 1 CE - 400 CE Roman Empire H8c Direct
Portrait of ancient individual R37 from Italy, dated 1 CE - 400 CE
R37
Italy Imperial Rome 1 CE - 400 CE Roman Empire HV Direct
Portrait of ancient individual R41 from Italy, dated 1 CE - 400 CE
R41
Italy Imperial Rome 1 CE - 400 CE Roman Empire H5a1 Direct
Portrait of ancient individual R43 from Italy, dated 1 CE - 400 CE
R43
Italy Imperial Rome 1 CE - 400 CE Roman Empire H7f Direct
Portrait of ancient individual R49 from Italy, dated 1 CE - 400 CE
R49
Italy Imperial Rome 1 CE - 400 CE Roman Empire H1u Direct
Portrait of ancient individual R75 from Italy, dated 1 CE - 200 CE
R75
Italy Imperial Rome 1 CE - 200 CE Roman Empire H14a Direct
Chapter VI

Carrier Distribution Map

Geographic distribution of 100 ancient DNA samples carrying haplogroup H1AH2

Time Period Filter
All Time Periods
Showing all samples
Each marker represents an ancient individual
Chapter VII

Temporal Distribution

Distribution of carriers across archaeological periods

Chapter VIII

Geographic Distribution

Distribution of carriers by country of origin

Chapter IX

Country × Era Distribution

Cross-tabulation of carrier countries and archaeological periods

Data

Data & Provenance

Source information and data quality

Last Updated 2026-02-16
Confidence Score 50/100
Coverage Low
Data Source

We use the latest phylotree for MTDNA haplogroup classification and data.